spring-prometheus-grafana
For correct operation it is necessary to make some steps:
1- Run the command docker-compose up -d --build in the terminal:

2- Run the API:

Now, the containers are up. Prometheus is in localhost:9090 and grafana in localhost:3000. Can be configured to monitor the metrics.
Configuring prometheus in the grafana
1- Access localhost:3000 and use user: admin, password: admin
2- Click in Configuration -> Data Sources: 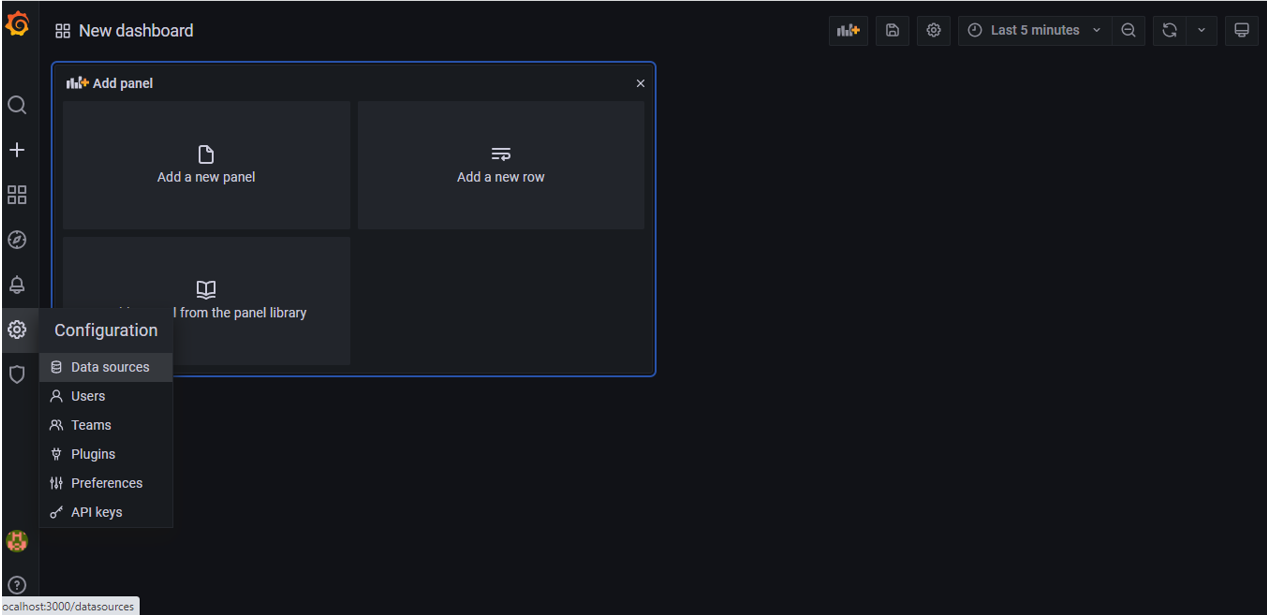
3- Select the "Prometheus" data source
4- Now, to configure Promteheus is necessary add URL = http://prometheus:9090 and to click in Save & Test: 
Configuring metrics
1- First, lets generate some metrics, so access http://localhost:7000/{name-of-tag} how many times you want: 
2- Counter metric. In Grafana add a new panel, select the type of visualization "Stat" and add the metric "spring_counter_http_request_total" in the fiel metrics browser, click in Apply, ready! The counter metric is configured: 
3- Gauge metric. Add a new panel, select type of visualization "Gauge" and add the metric "spring_gauge_online_users", click in Apply, ready! The gauge metric is configured (important, this metric is generate with random value in the api): 
4- Histogram metric. Add a new panel, select type of visualization "Graph" or other of your preference and add the metric "spring_histogram_request_durantion_count", click in Apply, ready! The histogram metric is configured: 
5- Ready, the metrics are set and we can access localhost:7000/nameoftag to see the values changes in grafana: 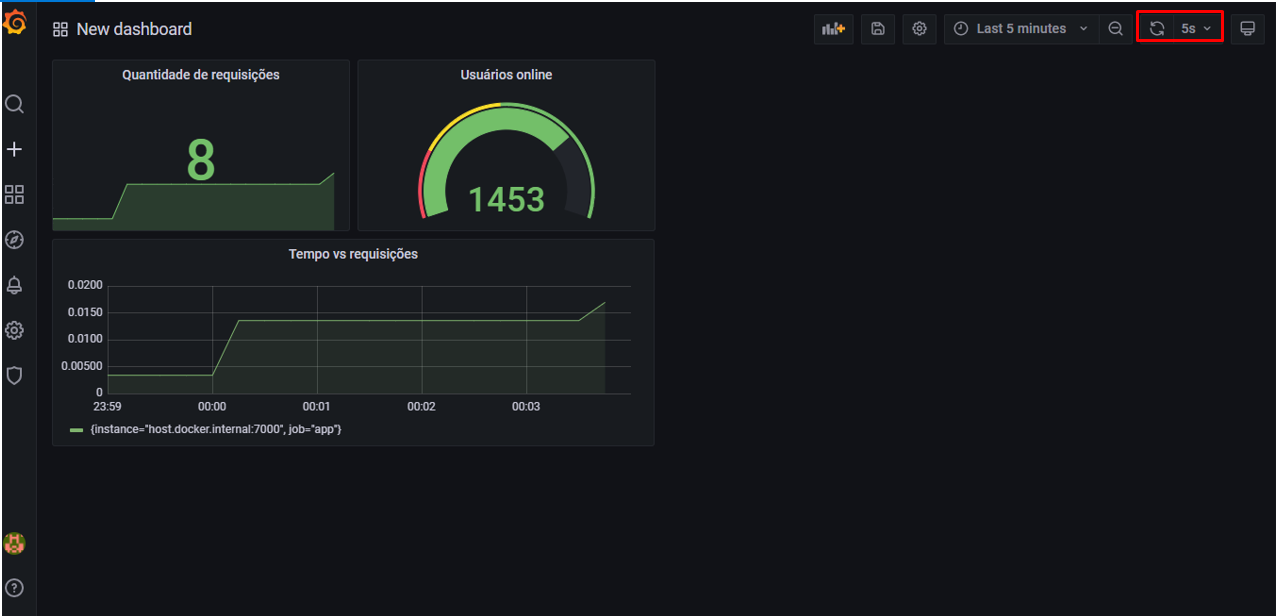
OBS: These settings will NOT be saved.


 2.9k Dec 31, 2022
 1 Jan 27, 2022
 1 Feb 5, 2022
 24.8k Jan 6, 2023
 4.5k Dec 30, 2022
 15.7k Dec 31, 2022
 19 Sep 23, 2022
 11 Apr 11, 2022
 7 Dec 20, 2022