A scientific charting library focused on performance optimised real-time data visualisation at 25 Hz update rates for data sets with a few 10 thousand up to 5 million data points.

Overview

Join the chat at https://gitter.im/fair-acc/chart License Maven Central Maven Central

Codacy Badge Language grade: Java Coverity Build Status

ChartFx

ChartFx is a scientific charting library developed at GSI for FAIR with focus on performance optimised real-time data visualisation at 25 Hz update rates for data sets with a few 10 thousand up to 5 million data points common in digital signal processing applications. Based on earlier Swing-based designs used at GSI and CERN, it is a re-write of JavaFX's default Chart implementation and aims to preserve the feature-rich and extensible functionality of earlier and other similar Swing-based libraries while addressing the performance bottlenecks and API issues. The motivation for the re-design has been presented at IPAC'19 (paper, poster). You can see a recent presentation at JFX Days here.

ChartFx example

Example showing error-bar and error-surface representations, display of mock meta-data, `ChartPlugin` interactors and data parameter measurement indicators (here: '20%-80% rise-time' between 'Marker#0' and 'Marker#1').

Functionalities and Features

The library offers a wide variety of plot types common in the scientific signal processing field, a flexible plugin system as well as online parameter measurements commonly found in lab instrumentation. Some of its features include (see demos for more details):

  • DataSet: basic XY-type datasets, extendable by DataSetError to account for measurement uncertainties, DataSetMetaData, EditableDataSet, Histogram, or DataSet3D interfaces;
  • math sub-library: FFTs, Wavelet and other spectral and linear algebra routines, numerically robust integration and differentiation, IIR- & FIR-type filtering, linear regression and non-linear chi-square-type function fitting;
  • Chart: providing euclidean, polar, or 2D projections of 3D data sets, and a configurable legend;
  • Axis: one or multiple axes that are linear, logarithmic, time-series, inverted, dynamic auto-(grow)-ranging, automatic range-based SI and time unit conversion;
  • Renderer: scatter-plot, poly-line, area-plot, error-bar and error-surfaces, vertical bar-plots, Bezier-curve, stair-case, 1D/2D histograms, mountain-range display, true contour plots, heatmaps, fading DataSet history, labelled chart range and indicator marker, hexagon-map, meta data (i.e. for indicating common measurement errors, warnings or infos such as over- or under-ranging, device or configuration errors etc.);
  • ChartPlugin: data zoomer with history, zoom-to-origin, and option to limit this to X and/or Y coordinates, panner, data value and range indicators, cross-hair indicator, data point tool-tip, DataSet editing, table view, export to CSV and system clipboard, online axis editing, data set parameter measurement such as rise-time, min, max, rms, etc.

In order to provide some of the scenegraph-level functionality while using a Canvas as graphics backend, the functionality of each module was extended to be readily customized through direct API methods as well as through external CSS-type style sheets.

Example Usage

Add the library to your project

All chart-fx releases are deployed to maven central, for maven you can add it to your pom.xml like this:

<dependencies>
  <dependency>
    <groupId>de.gsi.chart</groupId>
    <artifactId>chartfx-chart</artifactId>
    <version>11.1.5</version>
  </dependency>
</dependencies>

or your build.gradle like this:

implementation 'de.gsi.chart:chartfx-chart:11.1.5'

To use different build systems or library versions, have a look at the snippets on maven central.

While most users will need the chartfx-chart artifact it is also possible to use the data containers from chartfx-dataset and the algorithms from chartfx-math independently without the quite heavy UI dependencies.

Using the snapshot repository

If you want to try out unreleased features from master or one of the feature branches, there is no need to download the source and build chart-fx yourself. You can just use the <branchname>-SNAPSHOT releases from the sonatype snapshot repository for example by adding the following to your pom.xml if you want to use the current master. All available snapshot releases can be found in the sonatype snapshot repository.

example pom.xml for current master (click to expand)
<dependencies>
    <dependency>
        <groupId>de.gsi.chart</groupId>
        <artifactId>chartfx-chart</artifactId>
        <version>master-SNAPSHOT</version>
        <!-- <version>master-20200320.180638-78</version> pin to a specific snapshot build-->
    </dependency>
</dependencies>
<repositories>
    <repository>
        <id>oss.sonatype.org-snapshot</id>
        <url>http://oss.sonatype.org/content/repositories/snapshots</url>
        <releases>
            <enabled>false</enabled>
        </releases>
        <snapshots>
            <enabled>true</enabled>
        </snapshots>
    </repository>
</repositories>

Code Example

The following minimal working example can be used as a boilerplate project to get started with chart-fx.

simple ChartFx example

The corresponding source code `ChartFxSample.java` (expand)
package com.example.chartfx;

import de.gsi.chart.XYChart;
import de.gsi.chart.axes.spi.DefaultNumericAxis;
import de.gsi.dataset.spi.DoubleDataSet;
import javafx.application.Application;
import javafx.scene.Scene;
import javafx.scene.layout.StackPane;
import javafx.stage.Stage;

public class SimpleChartSample extends Application {
    private static final int N_SAMPLES = 100;

    @Override
    public void start(final Stage primaryStage) {
        final StackPane root = new StackPane();

        final XYChart chart = new XYChart(new DefaultNumericAxis(), new DefaultNumericAxis());
        root.getChildren().add(chart);

        final DoubleDataSet dataSet1 = new DoubleDataSet("data set #1");
        final DoubleDataSet dataSet2 = new DoubleDataSet("data set #2");
        // lineChartPlot.getDatasets().add(dataSet1); // for single data set
        chart.getDatasets().addAll(dataSet1, dataSet2); // two data sets

        final double[] xValues = new double[N_SAMPLES];
        final double[] yValues1 = new double[N_SAMPLES];
        final double[] yValues2 = new double[N_SAMPLES];
        for (int n = 0; n < N_SAMPLES; n++) {
            xValues[n] = n;
            yValues1[n] = Math.cos(Math.toRadians(10.0 * n));
            yValues2[n] = Math.sin(Math.toRadians(10.0 * n));
        }
        dataSet1.set(xValues, yValues1);
        dataSet2.set(xValues, yValues2);

        final Scene scene = new Scene(root, 800, 600);
        primaryStage.setTitle(this.getClass().getSimpleName());
        primaryStage.setScene(scene);
        primaryStage.setOnCloseRequest(evt -> System.exit(0));
        primaryStage.show();
    }
    public static void main(final String[] args) {
        Application.launch(args);
    }
}
And the corresponding build specification(expand) pom.xml:
<project>
<groupId>com.example.chartfx</groupId>
<artifactId>chartfx-sample</artifactId>
<name>chart-fx Sample</name>
<dependencies>
  <dependency>
    <groupId>de.gsi.chart</groupId>
    <artifactId>chartfx-chart</artifactId>
    <version>11.1.5</version>
  </dependency>
  <dependency>
    <groupId>org.slf4j</groupId>
    <artifactId>slf4j-simple</artifactId>
    <version>2.0.0-alpha0</version>
  </dependency>
</dependencies>
</project>
run with (expand)
mvn compile install
mvn exec:java

Examples

The chart-fx samples submodule contains a lot of samples which illustrate the capabilities and usage of the library. If you want to try them yourself run:

mvn compile install
mvn exec:java
CategoryAxisSampleCategoryAxisSample.java MultipleAxesSampleMultipleAxesSample.java TimeAxisSampleTimeAxisSample.java
LogAxisSampleLogAxisSample.java HistogramSampleHistogramSample.java Histogram2DimSampleHistogram2DimSample.java
EditDataSetSampleEditDataSetSample.java PolarPlotSamplePolarPlotSample.java EditDataSampleMetaDataRendererSample.java
HistoryDataSetRendererSampleHistoryDataSetRendererSample.java MountainRangeRendererSampleMountainRangeRendererSample.java ChartAnatomySampleChartAnatomySample.java
ErrorDataSetRendererStylingSample1ErrorDataSetRendererStylingSample.java ErrorDataSetRendererStylingSample2ErrorDataSetRendererStylingSample.java LabelledMarkerSampleLabelledMarkerSample.java
ContourChartSample1ContourChartSample.java ScatterAndBubbleRendererSampleScatterAndBubbleRendererSample.java
ContourChartSampleContourChartSample.java ScatterAndBubbleRendererSampleScatterAndBubbleRendererSample.java
ChartIndicatorSampleChartIndicatorSample.java
HistogramRendererTestsHistogramRendererTests.java

Financial related examples

Financial charts are types of charts that visually track various business and financial metrics like liquidity, price movement, expenses, cash flow, and others over a given a period of the time. Financial charts are a great way to express a story about business or financial markets (instruments, financial assets).

The chart-fx samples submodule contains financial charts and toolbox samples.

If you want to try them yourself run:

mvn compile install
mvn exec:java
FinancialCandlestickSampleFinancialCandlestickSample.java (Several Themes Supported) FinancialHiLowSampleFinancialHiLowSample.java (OHLC Renderer)
FinancialAdvancedCandlestickSampleFinancialAdvancedCandlestickSample.java (Advanced PaintBars and Extension Points) FinancialAdvancedCandlestickSampleFinancialRealtimeCandlestickSample.java (OHLC Tick Replay Real-time processing)

Math- & Signal-Processing related examples

The math samples can be started by running:

mvn compile install
mvn exec:java@math
DataSetAverageSampleDataSetAverageSample.java DataSetFilterSampleDataSetFilterSample.java DataSetIntegrateDifferentiateSampleDataSetIntegrateDifferentiateSample.java
DataSetSpectrumSampleDataSetSpectrumSample.java FourierSampleFourierSample.java FrequencyFilterSampleFrequencyFilterSample.java
GaussianFitSampleGaussianFitSample.java IIRFilterSampleIIRFilterSample.java WaveletScalogramWaveletScalogram.java

Other samples

There are also samples for the dataset and the accelerator UI submodules which will be extended over time as new functionality is added.

mvn compile install
mvn exec:java@dataset
mvn exec:java@acc-ui

Performance Comparison

Besides the extended functionality outlined above, the ChartFx optimisation goal also included achieving real-time update rates of up to 25 Hz for data sets with a few 10k up to 5 million data points. In order to optimise and compare the performance with other charting libraries, especially those with only reduced functionality, a reduced simple oscilloscope-style test case has been chosen (see RollingBufferSample in demos) that displays two curves with independent auto-ranging y-axes, common sliding time-series axis, and without further ChartPlugins. The test-case and direct performance comparison between the ChartFx and JavaFX charting library for update rates at 25 Hz and 2 Hz is shown below.

ChartFx performance comparison test-case Performance test scenario with two independent graphs, independent auto-ranging y-axes, and common scrolling time-series axis. Test system: Linux, 4.12.14, Intel(R) Core(TM) i7 CPU 860 @2.80GHz and GeForce GTX 670 GPU (NVIDIA driver).
JavaFX-ChartFx performance comparison for 25 Hz Performance comparison @ 25 Hz update rate. JavaFX-ChartFx performance comparison for 2 Hz Performance comparison @ 2 Hz update rate.

While the ChartFx implementation already achieved a better functionality and a by two orders of magnitude improved performance for very large datasets, the basic test scenario has also been checked against popular existing Java-Swing and non-Java based UI charting frameworks. The Figure below provides a summary of the evaluated chart libraries for update rates at 25 Hz and 1k samples.

ChartFx performance comparison

Chart performance comparison for popular JavaFX, Java-Swing, C++/Qt and WebAssembly-based implementations: ExtJFX, ChartFx, HanSolo Charts, JFreeChart, JDataViewer, QCustomPlot, Qt-Charts, WebAssembly. The last `Qt Charts` entries show results for 100k data points being updated at 25 Hz.

Some thoughts

While starting out to improve the JDK's JavaFX Chart functionality and performance through initially extending, then gradually replacing bottle-necks, and eventually re-designing and replacing the original implementations, the resulting ChartFx library provides a substantially larger functionality and achieved an about two orders of magnitude performance improvement. Nevertheless, improved functionality aside, a direct performance comparison even for the best-case JavaFX scenario (static axes) with other non-JavaFX libraries demonstrated the raw JavaFX graphics performance -- despite the redesign -- being still behind the existing Java Swing-based JDataViewer and most noticeable the Qt Charts implementations. The library will continued to be maintained here at GitHub and further used for existing and future JavaFX-based control room UIs at GSI. The gained experience and interfaces will provide a starting point for a planned C++-based counter-part implementation using Qt or another suitable low-level charting library.

Working on the source

If you want to work on the chart-fx sourcecode, either to play with the samples or to contribute some improvements to chartFX here are some instructions how to obtain the source and compile it using maven on the command line or using eclipse.

Maven on the command line

Just clone the repository and run maven from the top level directory. The exec:java target can be used to execute the samples. Maven calls java with the corresponding options so that JavaFX is working. Because of the way the project is set up, only classes in the chartfx-samples project can be started this way.

git clone
cd chart-fx
mvn compile install
mvn exec:java

Eclipse

The following has been tested with eclipse-2019-03 and uses the m2e maven plugin. Other versions or IDEs might work similar. Import the repository using Import -> Existing Maven Project. This should import the parent project and the four sub-projects. Unfortunately, since chartfx does not use the jigsaw module system, but javafx does, running the samples using 'run as Java Application' will result in an error complaining about the missing JavaFX runtime. As a workaround we include a small helper class de.gsi.samples.util.LaunchJFX, which can be called with 'run as Java Application' and which launches the sample application. It accepts a class name as an argument, so if you edit the run configuration and put ${java_type_name} as the argument, it will try to start the class selected in the project explorer as a JavaFX application.

JavaFX jvm command line options

If you cannot use the 2 previous methods it is also possible to manually specify the access rules to the module system as jvm flags. Adding the following to the java command line call or your IDEs run configuration makes the required modules available and accessible to chartfx:

--add-modules=javafx.swing,javafx.graphics,javafx.fxml,javafx.media,javafx.web
--add-reads javafx.graphics=ALL-UNNAMED
--add-opens javafx.controls/com.sun.javafx.charts=ALL-UNNAMED
--add-opens javafx.controls/com.sun.javafx.scene.control.inputmap=ALL-UNNAMED
--add-opens javafx.graphics/com.sun.javafx.iio=ALL-UNNAMED
--add-opens javafx.graphics/com.sun.javafx.iio.common=ALL-UNNAMED
--add-opens javafx.graphics/com.sun.javafx.css=ALL-UNNAMED
--add-opens javafx.base/com.sun.javafx.runtime=ALL-UNNAMED`

Extending chartfx

If you find yourself missing some feature or not being able to access specific chart internals, the way to go is often to implement a custom plugin or renderer.

Plugins are a simple way to add new visualisation and interaction capabilities to chart-fx. In fact a lot of chart-fx' own features (e.g. zoom, data editing, measurements) are implemented as plugins, as you can see in the sample applications. Your plugin can directly extend ChartPlugin or extend any of the builtin plugins. The Plugin Base class provides you with access to the chart object using getChart(). Your plugin should always add a Listener to the chartProperty, because when it is created there will not be an associated chart, so at creation time, calls to e.g. getChart() will return null. Using a custom plugin boils down to adding it to the chart by doing chart.getPlugins().add(new MyPlugin()). If you wrote a plugin which might be useful for other users of chart-fx please consider doing a pull request against chart-fx.

Renderers are the components which do the actual heavy lifting in drawing the components of the graph to the canvas. A chart can have multiple renderers added using chart.getRenderers().add(...) There are renderers which visualise actual data like the ErrorDataSetRenderer which is also the renderer added to new charts by default. These Renderers operate on all DatasSets added to the chart (chart.getDatasets.add(...)) as well as on the ones added to the renderer itself. As a rule of thumb, you need to implement a custom renderer if you need to visualize lots of data points or if you want to draw something behind the chart itself.

Acknowledgements

We express our thanks and gratitude to the JavaFX community, in particular to @GregKrug and Vito Baggiolini at CERN for their valuable insights, discussions and feedback on this topic.

Comments
  • Financial charts

    Financial charts

    We are planning to implement new financial platform. There are requirements for realtime processing. Almost all reqs are based on time series. The type of charts are candlesticks, HiLo renderers. About UI control is necessary to move dynamically and fast in windowed time range, to see detailed structure of prices. The last important req is possibility to add lines to the chart for visualization entries and exits of trades. There can be a thousands these objects which can be added to the chart for visualization. Is it possible to used your library for it? Or do you recommend to start from javafx directly? Thanks for your advice.

    enhancement 
    opened by raven2cz 39
  • Number formatting for automatic dataset names

    Number formatting for automatic dataset names

    Hi again,

    I continue to enjoy building something up with chart-fx. One thing that has bugged me recently are the auto-generated names for datasets created from some computation, in particular things like DataSetMath. They are very informative, but a lot of them directly stringify double values such as interval bounds. Because of this, the names quickly become unwieldy to show to humans:

    example (remaining name is cut off)

    I have already written a formatter that is used for axis labels/ticks, indicators, hover info, info about measurements and so on. My trouble is in applying this format to the names of the mentioned datasets. If I am not missing something, at the moment I'd have to either duplicate and adapt the naming logic to change the series' names when they are calculated, or try to parse out any numeric values from the names, re-format them and put the name back together when I display it. Both of these are theoretically possible, but are also time-consuming and don't sound like the best solutions.

    Ideally, I would want DataSetMath and MultiDimDataSetMath to use a configurable formatter for numbers in the names they assign. They could hold a default "identity" StringConverter< Number > that matches the current behaviour (or maybe uses a default NumberFormat / DecimalFormat like is used in other places) and expose a method to change this converter to a user-supplied one.

    Do you think this would be a reasonable addition? Cheers, Domenic

    enhancement 
    opened by domenicquirl 18
  • What is the professional way to invert xAxis values from max to min?

    What is the professional way to invert xAxis values from max to min?

    Hi Dears, First of all I want to thank you again for this amazing work!

    Here, I'm trying to draw the xAxis from the "Max" to the "Min" values. I'm not sure, how can I do it easily?

    inxax

    Thanks a lot

    opened by osaidmakhalfeh 17
  • Basic Questions

    Basic Questions

    Background

    First of all, thanks for writing a JavaFX charting library. I've been using JChart2D for what seems like forever, and I can't wait to finally get rid of the last remaining Swing parts.

    I've been working on an application that visualizes streaming sensor/measurement data in real-time. One of the features is a way for non-programmers to create custom charts via XML files where they can specify equations as well as things like default ranges, colors, styles, and so on. For example

    <chart title="GYROSCOPE" min_range="-3" max_range="+3" range_policy="expanding">
        <trace label="gyroX" units="rad/s" color="red" style="solid" value="fbk.gyroX" />
        <trace label="gyroY" units="rad/s" color="green" style="solid" value="fbk.gyroY" />
        <trace label="gyroZ" units="rad/s" color="blue" style="solid" value="fbk.gyroZ" />
    </chart>
    

    image

    and

    <chart title="LATENCY" min_range="0" max_range="0.5" range_policy="expanding">
        <trace label="Round Trip Time (RTT)" units="ms" color="black" style="points" value="(fbk.pcRxTime - fbk.pcTxTime)*1E3" />
        <trace label="Hardware Response Time" units="ms" color="blue" style="points" value="(fbk.hwTxTime - fbk.hwRxTime)*1E3" />
        <trace label="Transmit Time dt" units="ms" color="green" style="points" value="isNaN(prevFbk.pcTxTime) ? 0 : (fbk.pcTxTime - prevFbk.pcTxTime)*1E3" />
    </chart>
    

    image

    Unfortunately, I keep running into various basic issues when trying to port the charts over to chart-fx.

    Questions / Problems

    • We typically want to show the last N measurements, or the last (up to N) measurements within some time period. It'd be nice to have a LimitedCircularDoubleDataSet. It sounds very much like #8, so I'd second that as a feature request. Once I'm more familiar with this library I may be able to contribute something.

    • How can I dynamically set colors for individual datasets? The only reference I've found was in RollingBufferLegacyExample via setting the chart style for .default-color{index}.chart-series-line{...}. Unfortunately, doing that doesn't seem to have any effect.

    • Similarly, how can I selectively change the style of individual datasets? e.g. render one dataset with only markers (e.g. MATLAB's ., o, x), and another dataset as a solid/dashed/dotted line without markers (e.g. MATLAB's -, --, :). DataSet::getDataStyleMap::put seems to apply only to individual points

    • How can I render a dashed line? I found some usages of DashPatternStyle in the GridRenderer, but found nothing about using it for individual datasets.

    • What JDK/JFX version were you using for the performance comparisons in your paper? In particular, I'd be interested to know whether the numbers are before or after the Marlin renderer changes.

    Thanks!

    Edit: cleaned up the questions a bit

    opened by ennerf 17
  • Redrawing chart after updating Datasets doesn't work consistently

    Redrawing chart after updating Datasets doesn't work consistently

    Hi! Thank you for your work on ChartFX.

    I'm having an issue with redrawing a chart after updating its datasets. I update datasets as follows:

    public void update(List<DataPoint> dataPoints) {
        renderer.getDatasets().clear();
        DefaultDataSet dataSet = new DefaultDataSet("DataSet");
        for (DataPoint dataPoint : dataPoints) {
                double retTime = dataPoint.getRetTime();
                double intensity = dataPoint.getIntensity();
                dataSet.add(retTime, intensity);
        }
        renderer.getDatasets().add(dataSet);
    }
    

    where renderer is ErrorDataSetRenderer added to an XYChart.

    When I call this function, sometimes I get a correct plot and sometimes I get a blank background. Here are a few examples:

    Screen Shot 2020-09-16 at 12 45 03 PM Screen Shot 2020-09-16 at 12 45 14 PM Screen Shot 2020-09-16 at 12 45 26 PM Screen Shot 2020-09-16 at 12 45 36 PM Screen Shot 2020-09-16 at 12 45 45 PM

    I was able to solve this issue by calling chart.layout() after I update datasets, as follows:

    public void update(List<DataPoint> dataPoints) {
        renderer.getDatasets().clear();
        DefaultDataSet dataSet = new DefaultDataSet("DataSet");
        for (DataPoint dataPoint : dataPoints) {
                double retTime = dataPoint.getRetTime();
                double intensity = dataPoint.getIntensity();
                dataSet.add(retTime, intensity);
        }
        renderer.getDatasets().add(dataSet);
    
        chart.layout()
    }
    

    The latter code works and displays all plots correctly whenever the legend is visible (i.e. chart.setLegendVisible(true)). However, when the legend isn't visible, then the plots are still sometimes displayed and sometimes not. I want my users to be able to hide the legend, so I guess I need another solution for my problem.

    Maybe, I just don't call a correct function to update charts. What is the recommended ways to redraw plots after updating datasets?

    bug:minor 
    opened by asmirn1 15
  • ContourChart: memory not released ?

    ContourChart: memory not released ?

    Hi,

    I would like to thank everyone who worked hard on Chart-Fx.

    I am using the ContourChart to draw like one million point, here is an image of what I draw:

    psd

    Note that each time I get more points and redraw them after clearing the chart using getDatasets().clear().

    When I switch between views, it seems as if the points data are maintained in memory. I'm not really sure if there is something I should do since I'm relying on the garbage collector to do this for me which doesn't seem to do anything.

    opened by LaithBudairi 12
  • [Question] Styling guide for dark theme

    [Question] Styling guide for dark theme

    Sorry, i don't know where to turn with my question so I'll post it here.

    Firstly, i really enjoy working with chart-fx. It is by far the best charting lib for my use case that I have ever come across! Thanks for your effort!

    I am currently writing an application which has a dark theme and I was not yet able to completely figure out how to style chart-fx so that it renders nicely on a dark background. I am currently trying to find how to set the color of label of the axis (i suppose it is the axis tick label?) but what ever I do, it remains black (see attached screenshot).

    I have tried setting it via css

    .axis-label {
         /*this sets the axis label ("value [m/s²]") correctly*/
        -fx-fill: lightgrey;
    
        /*these two don't seem to work*/
        -fx-text-fill: yellow;
        -fx-tick-label-fill: red
    }
    

    or via the Axis using setTickLabelFill = Color.CYAN;

    The result is always a chart with black tick labels: image

    I also checked the JavaFX Documentation for Styling Charts with CSS as well as the JavaFX CSS Reference Guide but found nothing that helped me.

    I would appreciate it very much if you can help me with this styling issue or direct me to a place where i can find more help! Thanks!

    opened by deepthought-64 12
  • chart-fx threads memory leak

    chart-fx threads memory leak

    Hi everyone. I have a memory problem with the charts. the chart-fx threads are not getting terminated when I close the charts view, thus the allocated stack memory by the threads is not getting released.

    this is a scenario of my case: 1 - I open a new Scene with two bar charts, two contour charts with no data on them.

    charts: image

    memory: image

    2- add data to the charts.

    charts: image

    memory: image

    3- move to other views by changing the parent of the current scene memory: image

    the chart-fx threads still occupy the memory.

    4- open the charts view again with empty charts and start reading data ( the same data as the first time) charts: image

    memory: image

    I've tried some solutions but nothing worked for me. I don't have a problem with heap memory.

    opened by amjadmoqade98 11
  • CrosshairIndicator Label not updated on mouse-move using JMetro

    CrosshairIndicator Label not updated on mouse-move using JMetro

    After some time i got back to working on my UI Project. :)

    I added the de.gsi.chart.plugins.CrosshairIndicator plugin to a chart. The lines (crosshairPath) works as expected. But the label (coordinatesLabel) is not updated on mouse-move but only when i zoom in/out of the chart.

    Best see a short video as demonstration: chart-label-issue2 
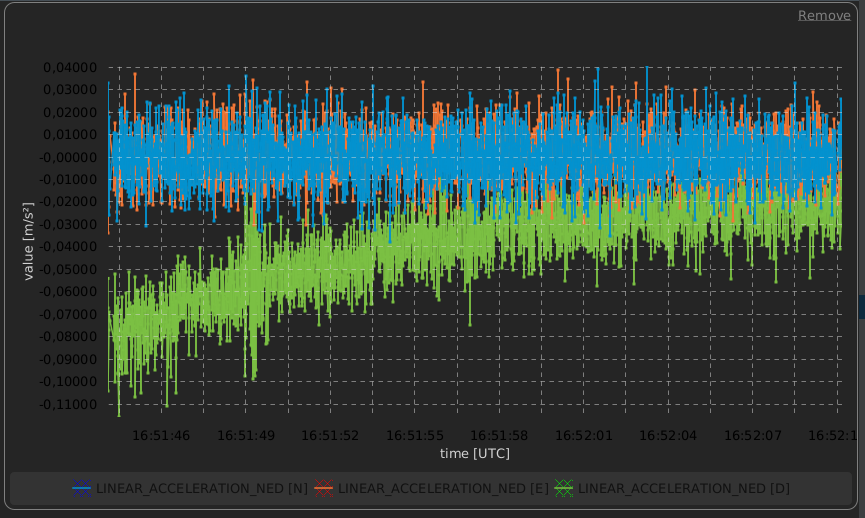
You see at the beginning it does not show the text at all, but only after i zoomed out, it rendered the label. But then it got stuck on one value until the next zoooming.

    I checked to verify that the method private void updateLabel(final MouseEvent event, final Bounds plotAreaBounds) inCrosshairIndicator is actually invoked and also calls coordinatesLabel.setText() with the correct updated string. I have no clue why it is not rendered on the graph.

    I tried removing the Zoomer-Plugin to see if that may block it, but it did not work.

    I would appreciate if you could help me.

    I am using

    • JDK: OpenJDK 14.0.1
    • JavaFX 13.0.2
    • chart-fx: 11.1.5
    • OS: Linux 5.7.12-arch1-1
    opened by deepthought-64 10
  • StackOverflowError in method binarySearch()

    StackOverflowError in method binarySearch()

    Hello, everybody! I try to make oscilloscope using chart-fx. I use FloatDataSet to display oscilloscope data. I get data blocks from sound cart and send send it to display a chart. When I run my program I often get an error:

    Exception in thread "JavaFX Application Thread" java.lang.StackOverflowError
    	at de.gsi.dataset.spi.AbstractDataSet.binarySearch(AbstractDataSet.java:133)
    	at de.gsi.dataset.spi.AbstractDataSet.binarySearch(AbstractDataSet.java:133)
    	at de.gsi.dataset.spi.AbstractDataSet.binarySearch(AbstractDataSet.java:133)
    	at de.gsi.dataset.spi.AbstractDataSet.binarySearch(AbstractDataSet.java:133)
    	at de.gsi.dataset.spi.AbstractDataSet.binarySearch(AbstractDataSet.java:133)
    	at de.gsi.dataset.spi.AbstractDataSet.binarySearch(AbstractDataSet.java:133) etc.
    

    How can I fix it? Help me please.

    opened by Vado101 10
  • Any way to change color scheme?

    Any way to change color scheme?

    Hi, thanks for the great charting library.

    Is there any way to change the color scheme to the one from default JavaFX charts? chart.css doesn't use the colors that I see on the screen and I see that ErrorDataSetRenderer uses static calls to DefaultRenderColorScheme, but doesn't seem to have a method to set another scheme. DefaultRenderColorScheme does have different color arrays as fields, but again, I see no way to change which one is used or to add my own. I'd also like to disable hatching and symbols and just draw the lines themselves. FillPattern seems to have "solid" as an option, but it's not used anywhere, as far as I can tell. Am I missing something?

    As a side question: is there any way to break up the data inside one dataset? I'm getting series of independent readings from the same sensors over time and I don't want to create a bunch of new datasets for each one, as that would look confusing. So I want clear space to separate them, but by default the last point of the previous series and the first point of the new one would get connected, as if it's the same series (which makes sense of course, but it's not what I want). In vanilla JavaFX charts I could traverse the node path and replace LineTo with MoveTo, which was very cumbersome, but generally worked. What's the approach here?

    opened by graynk 10
  • Missing Class

    Missing Class

    java: cannot find symbol symbol: class MultiArrayDouble location: package io.fair_acc.dataset.spi.utils

    • JavaFx version:
    • ChartFx version: [master, 11.2.2, ...]
    opened by Scarraluba 2
  • Fix CSS styling for GridRenderer

    Fix CSS styling for GridRenderer

    Describe the bug

    chart.css lists CSS selectors for styling the grid lines, but overwriting them currently does not work.

    .chart-major-vertical-lines .chart-major-grid-lines {
      /* use this to override v-specific settings */
    }
    
    .chart-major-horizontal-grid-lines .chart-major-grid-lines {
      /* use this to override h-specific settings */
    }
    

    This is because GridRenderer lives in a separate Scene with manual updates to applyCss, so it does not see any styles applied to the main chart. Applying styles directly to the renderer should work, but somehow that seems to have issues too.

    Workaround

    For now I made it work by adding the GridRenderer to an invisible/unmanaged group to an unused panel, e.g.,

    public static <T extends Chart> T fixChartCss(T chart) {
        if (chart instanceof XYChart xy) { 
            var hiddenGroup = new Group(xy.getGridRenderer());
            hiddenGroup.setVisible(false);
            hiddenGroup.setManaged(false);
            xy.getToolBar().getChildren().add(hiddenGroup);
        }
        return chart;
    }
    

    Discussion

    The approach with invisible lines seems to work well, but I think they should be part of the main scenegraph to avoid special casing and odd behavior. Do you think it would make sense to add a dedicated non-visible/unmanaged portion in Chart that exists only for CSS updates?

    If so, how should the GridRenderer register to the chart? The quick hack would be to add it on render(chart), but it may make sense to register it in a similar manner as plugins.

    opened by ennerf 0
  • wrong boolean expressions in ErrorDataSetRenderer.drawBubbles

    wrong boolean expressions in ErrorDataSetRenderer.drawBubbles

    The boolean expressions used in ErrorDataSetRenderer.drawBubbles are wrong and repeat/overlap so that only the first two braches ever match. Use conjunct clauses && to make distinct conditions for the branches.

    Environment:

    • ChartFx version: master
    • attribution: IntelliJ
    opened by protogenes 0
  • resolve performance issue caused by using DoubleArrayCache.getArrayExact

    resolve performance issue caused by using DoubleArrayCache.getArrayExact

    displaying live data from data sets with fluctuating size created a lot of GC pressure because the DoubleArrayCache required a new allocation almost every call to getArrayExact

    adjusting the ErrorDataSetRenderer and related classes to call DoubleArrayCache.getArray (using best fit strategy) instead removes this overhead

    the time spend in the cache easily took 90% of the render time in our case, because the cache list grews quite large

    opened by protogenes 4
  • blocked when use strokeDashPattern style

    blocked when use strokeDashPattern style

    When I set DoubleDataSet style with strokeDashPattern like "strokeDashPattern=5,5,5,5;" and add dataSet to chart ,the window become no response.

    follow the code:

    import de.gsi.chart.XYChart;
    import de.gsi.chart.axes.spi.DefaultNumericAxis;
    import de.gsi.dataset.spi.DoubleDataSet;
    import javafx.application.Application;
    import javafx.application.Platform;
    import javafx.scene.Scene;
    import javafx.stage.Stage;
    import java.util.Random;
    import java.util.concurrent.Executors;
    import java.util.concurrent.ScheduledExecutorService;
    import java.util.concurrent.TimeUnit;
    
    public class DashSample extends Application {
        private ScheduledExecutorService scheduledExecutorService = Executors.newScheduledThreadPool(1);
    
        @Override
        public void start(Stage primaryStage) throws Exception {
            final XYChart chart = new XYChart(new DefaultNumericAxis(), new DefaultNumericAxis());
            chart.setAnimated(false);
            chart.setLegendVisible(false);
    
            final Scene scene = new Scene(chart, 600, 400);
            primaryStage.setTitle(this.getClass().getSimpleName());
            primaryStage.setScene(scene);
            primaryStage.setOnCloseRequest(evt -> Platform.exit());
            primaryStage.show();
    
            scheduledExecutorService.schedule(() -> {
                Platform.runLater(() -> {
                    Random random = new Random();
                    final DoubleDataSet dataSet = new DoubleDataSet("myData");
                    for (int i = 0; i < 10; i++) {
                        dataSet.add(random.nextDouble(), random.nextDouble());
                    }
                    dataSet.setStyle("strokeDashPattern=5,5,5,5;");
                    chart.getDatasets().add(dataSet);
                });
            }, 3, TimeUnit.SECONDS);
        }
    }
    

    Environment:

    • OS: window 7
    • Java version: jdk1.8.0_311
    • ChartFx version: 8.1.5
    opened by lanny886 2
  • A vertical axis problem when using contour plot

    A vertical axis problem when using contour plot

    When using the contour plots, there seems to be a vertical axis bug when enlarging vertically (which works fine), and then when shrinking back down. To easily reproduce, just try the following with your WaterfallPerformanceSample in your chart.samples.

    At first, everything is fine plot/functionality wise when launched. But then vertically increase height of window, then go back down to default size. You'll lose the x-axis. I would expect that the contour chart stretches/shrinks vertically and fits according to the window size, similar to all other chart types, as well as horizontal stretching/shrinking works fine as expected.

    Thanks for your help in advance. Fantastic library nonetheless!

    Screenshot from 2022-10-10 19-35-28

    Environment:

    • OS: [e.g. Ubuntu 20.04]
    • Java version: openjdk 11
    • JavaFx version: 11
    • ChartFx version: [master, 11.2.2, ...]
    opened by clisztian 1
Releases(11.2.7)
  • 11.2.7(Apr 26, 2022)

    New Features

    • add visibility state and toggling of datasets (#481)
      • added visibility state to datasets and the error renderer
      • changed EditDataSet to not allow modifications on hidden datasets
      • Thanks for @ennerf for contributing this feature
    • add TimeAxisNonLinearSample which shows how to implement custom axes.

    Bugfixes

    • Allow to apply colors for bar charts per data point using the dataset.addDataStyle(index, "fillColor=cyan;") API. Thanks @edkennard for reporting, fixing and contributing! :+1:
    • Fix axis range for padded axes solves #469 by also using the computed autoRange() result which includes the padding when calculating the tick marks.
    • Prevent relayouting of the chart on indicator change (#485) Set the layout property of the indicator triangle to unmanaged s.t. changes on the triangle will not invalidate the layout of its parent. fixes #476

    Housekeeping

    • github actions: continue on error for codacy coverage
    • bump jackson-databind from 2.9.10.7 to 2.9.10.8 in /microservice

    Announcement This will be the last version for de.gsi.* packages. Starting with 11.3.0 chart-fx will move to the io.fair-acc.* prefix and this repository will be moved to the fair-acc github organisation to align with our other open source packages. This should not change too much for you as a user except that you will have to update your imports (sorry for that), but will simplify our development and open source deployment processes a lot. After this move we then want to also tackle some bigger improvements.

    Source code(tar.gz)
    Source code(zip)
  • 11.2.6(Nov 8, 2021)

    New feature/enhancements and fixes for user-reported bugs and those identified via static-code-analysis (Codacy, lgtm & coverity)

    new functionalities:

    • user agent style sheet for default css and corresponding sample
    • Financial Footprint Chart Renderer added. (#415)
    • allow the ci to be run for external PRs
    • peak-width-via-integral estimator
    • new Formatter interface definition (#444)

    bug fixes:

    • fix padded auto grow ranging & added PaddedAutoGrowAxisSample
    • inverted non-auto-range axes defaulting to +-1 (#383)
    • show DataPointTooltip for first dataset for overlapping points (#457)
    • ValueIndicator: disable dragging for non editable indicators
    • Add test dataset for different error types to ErrorDataSetRendererSample
    • Fix DefaultDataReducer, correct treatment of NaN values, and added unit-test
    • fixed DataSetMath integration and ErrorDataSetRenderer bug
    • YWatchValueIndicator: improvements, prevent occlusion of value labels and fix YWatchValueIndicatorTest (#443)
    • miscellaneous fixes for issues detected by static-code analysis tools (Codacy, lgtm & coverity)
    Source code(tar.gz)
    Source code(zip)
  • 11.2.5(Mar 8, 2021)

    No new features but an important bug-fix for an issue that has been introduced with the 11.2.4 release.

    bug fixes:

    • fixes autoranging for CircularDoubleErrorDataSet (issue #378)
    • some additional unit-tests and follow-up fixes
    Source code(tar.gz)
    Source code(zip)
  • 11.2.4(Mar 5, 2021)

    This release has a few new features and mostly bug-fixes for user-reported issues.

    Special thanks to @raven2cz and @dedeibel! :+1:

    new features:

    • financial charts: positions and orders added
    • move from Travis to Github Actions (#348)

    bug fixes:

    • add missing invokeListener(..) on set(DataSet, boolean) methods
    • fixes issue366 (#367)
    • fix337 tooltip synchronization (#339)
    • TableViewer: fix calls to hashCode of DataSetsRow & unit-test (#343)
    • TableViewer: table cells can now be selected again (#341)
    • miscellaneous fixes reported by Coverity and Codacy
    Source code(tar.gz)
    Source code(zip)
  • 11.2.3(Dec 18, 2020)

    This release has a few bug-fixes and notably new renderers targeting financial applications.

    Special thanks to @raven2cz and @HanSolo who contributed to this release. :+1:

    new features:

    • CandleStickRenderer, HighLowRenderer, Basic Financial API (#316, #326) For details, please have a look at the snapshots and demos provided.
    • GitHub action that runs the tests on each push also for users outside the organisation

    bug fixes:

    • Correct automatic module names (N.B. may not contain '-' since JDK9 #321)
    • Fixed MultiArray and DoubleGrid DataSets to use row-major storage as documented (#329) This is an internal change and most users should not be affected by this. N.B. rationale: depending on the math sub-domain:
      • algebra (matrices, tensors, etc.) commonly use row-major notation, while
      • charting typically requires column-major order. ie. abscissa (e.g. 'x'-coordinate)==column before ordinate (e.g. 'y'-coordinate) ==row. Transposing the dimensions/shape is now done in the top-most DataSet interface that is being plotted.

    Finally, a quick show-case of one of the many new financial chart related features: image

    Source code(tar.gz)
    Source code(zip)
  • 11.2.2(Nov 13, 2020)

    This release has a few new features and bug-fixes for user-reported issues.

    new features:

    • generic RESTful 'Clipboard' (#272) that facilitates a simple web-export of Java, JavaFX, and (of course) Chart-fx content.
    • new HistogramRenderer with support for non-equidistant binning (#292, notably issues: #80 #246 #265)
    • upgraded DataSetMath: support math-operation on DataSets with different x-axis sampling
    • upgrades to DataPointTooltip plugin:
      • show tool tip for all data in chart
      • make 'Label' fully customisable through overwridable DataPointTooltip::updateLabel(...)
      • use AbstractAxisFormatting facilities instead of custom code in the Tooltip plugin
    • uploaded initial concepts for a new middle-ware and microservice backend (WIP: #272, #273, #298, #307, #312)

    bug fixes:

    • fixed setAutoRangePadding() regression bug (#277)
    • add table view only to chart if really shown (#280, special thanks to @dedeibel)
    • fixed slow axis memory-leak by replacing WeakHashMap with SoftHashMap<...,TickMark> - based cache implementation (#291)
    • fixed indexing error HistogramRenderer::drawPolyLineStairCase(..)
    • fix scroll zoom bug (special thanks to @milo-gsi)
    Source code(tar.gz)
    Source code(zip)
  • 11.2.1(Oct 1, 2020)

    This release contains only small bugfixes from issues or leftovers from the 11.2. refactoring:

    • Histogram indexing fixed and clarified bin boundaries when using the constructor
    • Axes now get consistently updated on range change (#259)
    • Inverted x-Axis did not show labels bc of overlap detection (#261)
    • Error DataSetRenderer for inverted x-Axis
    • Wrong errors on last point after data reduction (#265)
    • Oscilloscope axis was broken and needed adjustments
    • FXML support was broken due to a missing default constructor
    • Additional unit tests (AbstractAxis) and code cleanup
    Source code(tar.gz)
    Source code(zip)
Owner
GSI CS-CO/ACO
GSI Helmholtz Centre for Heavy Ion Research - Accelerator Controls
GSI CS-CO/ACO
Create your own auto-update framework

Read the documentation, explore the JavaDoc, or see it in action Create a framework: design the environment and lifecycle (—bootstrap) to make your ow

null 698 Dec 29, 2022
Ini adalah Launcher SAMP untuk android, ini hanya untuk mengganti nama dan kemungkinan di update lanjutnya akan mendukung download client. Bersenang senanglah!!!

SAMP-Launcher-Android Ini adalah Launcher SAMP untuk android, ini hanya untuk mengganti nama dan kemungkinan di update lanjutnya akan mendukung downlo

Kiril 3 Nov 3, 2022
A low intrusive, configurable android library that converts layout XML files into Java code to improve performance

qxml English 一个低侵入,可配置的 Android 库,用于将 layout xml 文件转换为 Java 代码以提高性能。 与X2C的对比 X2C: 使用注解处理器生成View类,使用时需要在类中添加注解,并替换setContentView方法,侵入性较强; 对于布局属性的支持不够完美

null 74 Oct 6, 2022
A high-performance Java API wrapper for arblib, the fantastic and amazing arbitrary-precision ball arithmetic C library, implemented via SWIG

A high-performance Java API wrapper for arblib, the fantastic and amazing arbitrary-precision ball arithmetic C library, implemented via SWIG

null 3 Dec 19, 2022
A Time Series Data Browser

Contents What is binjr? Features Getting started Trying it out Getting help Contributing How is it licensed? What is binjr? binjr is a time series bro

binjr 206 Dec 17, 2022
JFXNodeMapper - a simple library that focuses on mapping data from common data represntation formats to JavaFx Nodes

JFXNodeMapper - a simple library that focuses on mapping data from common data represntation formats to JavaFx Nodes. Our main focus is to build a library that,

Aby Kuruvilla 7 Oct 15, 2021
A simple program that is realized by entering data, storing it in memory (in a file) and reading from a file to printing that data.

Pet project A simple program that is realized by entering data, storing it in memory (in a file) and reading from a file to printing that data. It can

Ljubinko Stojanović 3 Apr 28, 2022
A library of +70 ready-to-use animations for JavaFX

AnimateFX A library of ready-to-use animations for JavaFX Features: Custom animations Custom interpolators Play/Stop animation Play an animation after

Loïc Sculier 366 Jan 5, 2023
A JavaFX library that allows Java2D code (Graphics2D) to be used to draw to a Canvas node.

FXGraphics2D Version 2.1, 3 October 2020. Overview FXGraphics2D is a free implementation of Java's Graphics2D API that targets the JavaFX Canvas. It m

David Gilbert 184 Dec 31, 2022
A library for JavaFX that gives you the ability to show progress on the Windows taskbar.

A clean and easy way to implement this amazing native Windows taskbar-progressbar functionality in javaFX Background Since Windows 7 there is a taskba

Daniel Gyoerffy 77 Nov 28, 2022
A JavaFX 3D Visualization and Component Library

FXyz3D FXyz3D Core: FXyz3D Client: FXyz3D Importers: A JavaFX 3D Visualization and Component Library How to build The project is managed by gradle. To

null 16 Aug 23, 2020
A library for creating and editing graph-like diagrams in JavaFX.

Graph Editor A library for creating and editing graph-like diagrams in JavaFX. This project is a fork of tesis-dynaware/graph-editor 1.3.1, which is n

Steffen 125 Jan 1, 2023
Provides a Java API to use the JavaScript library d3.js with the JavaFx WebView

javafx-d3 Provides a Java API for using the JavaScript library d3.js with JavaFx Applications. Many thanks to the authors of the projects gwt-d3 [1] a

null 98 Dec 19, 2022
Kubed - A port of the popular Javascript library D3.js to Kotlin/JavaFX.

Kubed: A Kotlin DSL for data visualization Kubed is a data visualization DSL embedded within the Kotlin programming language. Kubed facilitates the cr

Brian Hudson 71 Dec 28, 2022
A 3D chart library for Java applications (JavaFX, Swing or server-side).

Orson Charts (C)opyright 2013-2020, by Object Refinery Limited. All rights reserved. Version 2.0, 15 March 2020. Overview Orson Charts is a 3D chart l

David Gilbert 96 Sep 27, 2022
A JavaFX library containing tiles that can be used for dashboards.

TilesFX A JavaFX library containing tiles for Dashboards. Donations are welcome at Paypal Intro The Tile is a simple JavaFX Control that comes with di

Gerrit Grunwald 1.3k Dec 30, 2022
Flow Visualization Library for JavaFX and VRL-Studio

VWorkflows Interactive flow/graph visualization for building domain specific visual programming environments. Provides UI bindings for JavaFX. See htt

Michael Hoffer 274 Dec 29, 2022
A Javafx Library for building MVC Applications.

A JavaFx Library For Making MVC Type Desktop Applications Installation requires Java jdk > 7 for windows requres openjdk-7 or 8 and openjfx for linux

Obi Uchenna David 38 Apr 30, 2022
Simple, maintained and highly customizable colorpicker library for Android.

Colorpicker Library for Android Simple, maintained and highly customizable color picker library for Android. It is packed with ColorPicker Popup, Colo

Mrudul Tora 31 Oct 3, 2022