Sampling CPU and HEAP profiler for Java featuring AsyncGetCallTrace + perf_events

Overview

async-profiler

This project is a low overhead sampling profiler for Java that does not suffer from Safepoint bias problem. It features HotSpot-specific APIs to collect stack traces and to track memory allocations. The profiler works with OpenJDK, Oracle JDK and other Java runtimes based on the HotSpot JVM.

async-profiler can trace the following kinds of events:

  • CPU cycles
  • Hardware and Software performance counters like cache misses, branch misses, page faults, context switches etc.
  • Allocations in Java Heap
  • Contented lock attempts, including both Java object monitors and ReentrantLocks

See our Wiki or 3 hours playlist to learn about all features.

Download

Current version (2.0-rc):

Stable release (1.8.4):

Previous releases

Note: async-profiler also comes bundled with IntelliJ IDEA Ultimate 2018.3 and later. For more information refer to IntelliJ IDEA documentation.

Supported platforms

  • Linux / x64 / x86 / ARM / AArch64
  • macOS / x64

Note: macOS profiling is limited to user space code only.

CPU profiling

In this mode profiler collects stack trace samples that include Java methods, native calls, JVM code and kernel functions.

The general approach is receiving call stacks generated by perf_events and matching them up with call stacks generated by AsyncGetCallTrace, in order to produce an accurate profile of both Java and native code. Additionally, async-profiler provides a workaround to recover stack traces in some corner cases where AsyncGetCallTrace fails.

This approach has the following advantages compared to using perf_events directly with a Java agent that translates addresses to Java method names:

  • Works on older Java versions because it doesn't require -XX:+PreserveFramePointer, which is only available in JDK 8u60 and later.

  • Does not introduce the performance overhead from -XX:+PreserveFramePointer, which can in rare cases be as high as 10%.

  • Does not require generating a map file to map Java code addresses to method names.

  • Works with interpreter frames.

  • Does not require writing out a perf.data file for further processing in user space scripts.

If you wish to resolve frames within libjvm, the debug symbols are required.

ALLOCATION profiling

Instead of detecting CPU-consuming code, the profiler can be configured to collect call sites where the largest amount of heap memory is allocated.

async-profiler does not use intrusive techniques like bytecode instrumentation or expensive DTrace probes which have significant performance impact. It also does not affect Escape Analysis or prevent from JIT optimizations like allocation elimination. Only actual heap allocations are measured.

The profiler features TLAB-driven sampling. It relies on HotSpot-specific callbacks to receive two kinds of notifications:

  • when an object is allocated in a newly created TLAB (aqua frames in a Flame Graph);
  • when an object is allocated on a slow path outside TLAB (brown frames).

This means not each allocation is counted, but only allocations every N kB, where N is the average size of TLAB. This makes heap sampling very cheap and suitable for production. On the other hand, the collected data may be incomplete, though in practice it will often reflect the top allocation sources.

Sampling interval can be adjusted with --alloc option. For example, --alloc 500k will take one sample after 500 KB of allocated space on average. However, intervals less than TLAB size will not take effect.

The minimum supported JDK version is 7u40 where the TLAB callbacks appeared.

Installing Debug Symbols

The allocation profiler requires HotSpot debug symbols. Oracle JDK already has them embedded in libjvm.so, but in OpenJDK builds they are typically shipped in a separate package. For example, to install OpenJDK debug symbols on Debian / Ubuntu, run:

# apt install openjdk-8-dbg

or for OpenJDK 11:

# apt install openjdk-11-dbg

On CentOS, RHEL and some other RPM-based distributions, this could be done with debuginfo-install utility:

# debuginfo-install java-1.8.0-openjdk

On Gentoo the icedtea OpenJDK package can be built with the per-package setting FEATURES="nostrip" to retain symbols.

The gdb tool can be used to verify if the debug symbols are properly installed for the libjvm library. For example on Linux:

$ gdb $JAVA_HOME/lib/server/libjvm.so -ex 'info address UseG1GC'

This command's output will either contain Symbol "UseG1GC" is at 0xxxxx or No symbol "UseG1GC" in current context.

Wall-clock profiling

-e wall option tells async-profiler to sample all threads equally every given period of time regardless of thread status: Running, Sleeping or Blocked. For instance, this can be helpful when profiling application start-up time.

Wall-clock profiler is most useful in per-thread mode: -t.

Example: ./profiler.sh -e wall -t -i 5ms -f result.html 8983

Java method profiling

-e ClassName.methodName option instruments the given Java method in order to record all invocations of this method with the stack traces.

Example: -e java.util.Properties.getProperty will profile all places where getProperty method is called from.

Only non-native Java methods are supported. To profile a native method, use hardware breakpoint event instead, e.g. -e Java_java_lang_Throwable_fillInStackTrace

Building

Build status: Build Status

Make sure the JAVA_HOME environment variable points to your JDK installation, and then run make. GCC is required. After building, the profiler agent binary will be in the build subdirectory. Additionally, a small application jattach that can load the agent into the target process will also be compiled to the build subdirectory.

Basic Usage

As of Linux 4.6, capturing kernel call stacks using perf_events from a non-root process requires setting two runtime variables. You can set them using sysctl or as follows:

# sysctl kernel.perf_event_paranoid=1
# sysctl kernel.kptr_restrict=0

To run the agent and pass commands to it, the helper script profiler.sh is provided. A typical workflow would be to launch your Java application, attach the agent and start profiling, exercise your performance scenario, and then stop profiling. The agent's output, including the profiling results, will be displayed in the Java application's standard output.

Example:

$ jps
9234 Jps
8983 Computey
$ ./profiler.sh start 8983
$ ./profiler.sh stop 8983

The following may be used in lieu of the pid (8983):

  • The keyword jps, which will use the most recently launched Java process.
  • The application name as it appears in the jps output: e.g. Computey

Alternatively, you may specify -d (duration) argument to profile the application for a fixed period of time with a single command.

$ ./profiler.sh -d 30 8983

By default, the profiling frequency is 100Hz (every 10ms of CPU time). Here is a sample of the output printed to the Java application's terminal:

--- Execution profile ---
Total samples:           687
Unknown (native):        1 (0.15%)

--- 6790000000 (98.84%) ns, 679 samples
  [ 0] Primes.isPrime
  [ 1] Primes.primesThread
  [ 2] Primes.access$000
  [ 3] Primes$1.run
  [ 4] java.lang.Thread.run

... a lot of output omitted for brevity ...

          ns  percent  samples  top
  ----------  -------  -------  ---
  6790000000   98.84%      679  Primes.isPrime
    40000000    0.58%        4  __do_softirq

... more output omitted ...

This indicates that the hottest method was Primes.isPrime, and the hottest call stack leading to it comes from Primes.primesThread.

Launching as an Agent

If you need to profile some code as soon as the JVM starts up, instead of using the profiler.sh script, it is possible to attach async-profiler as an agent on the command line. For example:

$ java -agentpath:/path/to/libasyncProfiler.so=start,event=cpu,file=profile.html ...

Agent library is configured through the JVMTI argument interface. The format of the arguments string is described in the source code. The profiler.sh script actually converts command line arguments to that format.

For instance, -e wall is converted to event=wall, -f profile.html is converted to file=profile.html, and so on. However, some arguments are processed directly by profiler.sh script. E.g. -d 5 results in 3 actions: attaching profiler agent with start command, sleeping for 5 seconds, and then attaching the agent again with stop command.

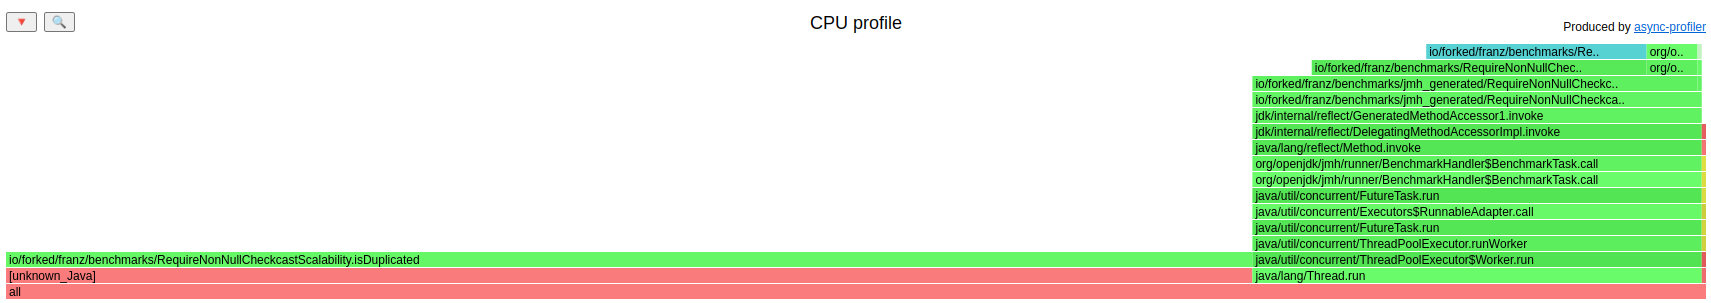
Flame Graph visualization

async-profiler provides out-of-the-box Flame Graph support. Specify -o flamegraph argument to dump profiling results as an interactive HTML Flame Graph. Also, Flame Graph output format will be chosen automatically if the target filename ends with .html.

$ jps
9234 Jps
8983 Computey
$ ./profiler.sh -d 30 -f /tmp/flamegraph.html 8983

Example

Profiler Options

The following is a complete list of the command-line options accepted by profiler.sh script.

  • start - starts profiling in semi-automatic mode, i.e. profiler will run until stop command is explicitly called.

  • resume - starts or resumes earlier profiling session that has been stopped. All the collected data remains valid. The profiling options are not preserved between sessions, and should be specified again.

  • stop - stops profiling and prints the report.

  • check - check if the specified profiling event is available.

  • status - prints profiling status: whether profiler is active and for how long.

  • list - show the list of available profiling events. This option still requires PID, since supported events may differ depending on JVM version.

  • -d N - the profiling duration, in seconds. If no start, resume, stop or status option is given, the profiler will run for the specified period of time and then automatically stop.
    Example: ./profiler.sh -d 30 8983

  • -e event - the profiling event: cpu, alloc, lock, cache-misses etc. Use list to see the complete list of available events.

    In allocation profiling mode the top frame of every call trace is the class of the allocated object, and the counter is the heap pressure (the total size of allocated TLABs or objects outside TLAB).

    In lock profiling mode the top frame is the class of lock/monitor, and the counter is number of nanoseconds it took to enter this lock/monitor.

    Two special event types are supported on Linux: hardware breakpoints and kernel tracepoints:

    • -e mem:<func>[:rwx] sets read/write/exec breakpoint at function <func>. The format of mem event is the same as in perf-record. Execution breakpoints can be also specified by the function name, e.g. -e malloc will trace all calls of native malloc function.
    • -e trace:<id> sets a kernel tracepoint. It is possible to specify tracepoint symbolic name, e.g. -e syscalls:sys_enter_open will trace all open syscalls.
  • -i N - sets the profiling interval in nanoseconds or in other units, if N is followed by ms (for milliseconds), us (for microseconds), or s (for seconds). Only CPU active time is counted. No samples are collected while CPU is idle. The default is 10000000 (10ms).
    Example: ./profiler.sh -i 500us 8983

  • --alloc N - allocation profiling interval in bytes or in other units, if N is followed by k (kilobytes), m (megabytes), or g (gigabytes).

  • --lock N - lock profiling threshold in nanoseconds (or other units). In lock profiling mode, record contended locks that the JVM has waited for longer than the specified duration.

  • -j N - sets the Java stack profiling depth. This option will be ignored if N is greater than default 2048.
    Example: ./profiler.sh -j 30 8983

  • -t - profile threads separately. Each stack trace will end with a frame that denotes a single thread.
    Example: ./profiler.sh -t 8983

  • -s - print simple class names instead of FQN.

  • -g - print method signatures.

  • -a - annotate Java method names by adding _[j] suffix.

  • -o fmt - specifies what information to dump when profiling ends. fmt can be one of the following options:

    • traces[=N] - dump call traces (at most N samples);
    • flat[=N] - dump flat profile (top N hot methods);
      can be combined with traces, e.g. traces=200,flat=200
    • jfr - dump events in Java Flight Recorder format readable by Java Mission Control. This does not require JDK commercial features to be enabled.
    • collapsed - dump collapsed call traces in the format used by FlameGraph script. This is a collection of call stacks, where each line is a semicolon separated list of frames followed by a counter.
    • flamegraph - produce Flame Graph in HTML format.
    • tree - produce Call Tree in HTML format.
      --reverse option will generate backtrace view.
  • --total - count the total value of the collected metric instead of the number of samples, e.g. total allocation size.

  • -I include, -X exclude - filter stack traces by the given pattern(s). -I defines the name pattern that must be present in the stack traces, while -X is the pattern that must not occur in any of stack traces in the output. -I and -X options can be specified multiple times. A pattern may begin or end with a star * that denotes any (possibly empty) sequence of characters.
    Example: ./profiler.sh -I 'Primes.*' -I 'java/*' -X '*Unsafe.park*' 8983

  • --title TITLE, --minwidth PERCENT, --reverse - FlameGraph parameters.
    Example: ./profiler.sh -f profile.html --title "Sample CPU profile" --minwidth 0.5 8983

  • -f FILENAME - the file name to dump the profile information to.
    %p in the file name is expanded to the PID of the target JVM;
    %t - to the timestamp at the time of command invocation.
    Example: ./profiler.sh -o collapsed -f /tmp/traces-%t.txt 8983

  • --all-user - include only user-mode events. This option is helpful when kernel profiling is restricted by perf_event_paranoid settings.

  • --cstack MODE - how to traverse native frames (C stack). Possible modes are fp (Frame Pointer), lbr (Last Branch Record, available on Haswell since Linux 4.1), and no (do not collect C stack).

    By default, C stack is shown in cpu, itimer, wall-clock and perf-events profiles. Java-level events like alloc and lock collect only Java stack.

  • --begin function, --end function - automatically start/stop profiling when the specified native function is executed.

  • --ttsp - time-to-safepoint profiling. An alias for
    --begin SafepointSynchronize::begin --end RuntimeService::record_safepoint_synchronized

  • -v, --version - prints the version of profiler library. If PID is specified, gets the version of the library loaded into the given process.

Profiling Java in a container

It is possible to profile Java processes running in a Docker or LXC container both from within a container and from the host system.

When profiling from the host, pid should be the Java process ID in the host namespace. Use ps aux | grep java or docker top <container> to find the process ID.

async-profiler should be run from the host by a privileged user - it will automatically switch to the proper pid/mount namespace and change user credentials to match the target process. Also make sure that the target container can access libasyncProfiler.so by the same absolute path as on the host.

By default, Docker container restricts the access to perf_event_open syscall. So, in order to allow profiling inside a container, you'll need to modify seccomp profile or disable it altogether with --security-opt seccomp=unconfined option. In addition, --cap-add SYS_ADMIN may be required.

Alternatively, if changing Docker configuration is not possible, you may fall back to -e itimer profiling mode, see Troubleshooting.

Restrictions/Limitations

  • On most Linux systems, perf_events captures call stacks with a maximum depth of 127 frames. On recent Linux kernels, this can be configured using sysctl kernel.perf_event_max_stack or by writing to the /proc/sys/kernel/perf_event_max_stack file.

  • Profiler allocates 8kB perf_event buffer for each thread of the target process. Make sure /proc/sys/kernel/perf_event_mlock_kb value is large enough (more than 8 * threads) when running under unprivileged user. Otherwise the message "perf_event mmap failed: Operation not permitted" will be printed, and no native stack traces will be collected.

  • There is no bullet-proof guarantee that the perf_events overflow signal is delivered to the Java thread in a way that guarantees no other code has run, which means that in some rare cases, the captured Java stack might not match the captured native (user+kernel) stack.

  • You will not see the non-Java frames preceding the Java frames on the stack. For example, if start_thread called JavaMain and then your Java code started running, you will not see the first two frames in the resulting stack. On the other hand, you will see non-Java frames (user and kernel) invoked by your Java code.

  • No Java stacks will be collected if -XX:MaxJavaStackTraceDepth is zero or negative.

  • Too short profiling interval may cause continuous interruption of heavy system calls like clone(), so that it will never complete; see #97. The workaround is simply to increase the interval.

  • When agent is not loaded at JVM startup (by using -agentpath option) it is highly recommended to use -XX:+UnlockDiagnosticVMOptions -XX:+DebugNonSafepoints JVM flags. Without those flags the profiler will still work correctly but results might be less accurate. For example, without -XX:+DebugNonSafepoints there is a high chance that simple inlined methods will not appear in the profile. When the agent is attached at runtime, CompiledMethodLoad JVMTI event enables debug info, but only for methods compiled after attaching.

Troubleshooting

Failed to change credentials to match the target process: Operation not permitted

Due to limitation of HotSpot Dynamic Attach mechanism, the profiler must be run by exactly the same user (and group) as the owner of target JVM process. If profiler is run by a different user, it will try to automatically change current user and group. This will likely succeed for root, but not for other users, resulting in the above error.

Could not start attach mechanism: No such file or directory

The profiler cannot establish communication with the target JVM through UNIX domain socket.

Usually this happens in one of the following cases:

  1. Attach socket /tmp/.java_pidNNN has been deleted. It is a common practice to clean /tmp automatically with some scheduled script. Configure the cleanup software to exclude .java_pid* files from deletion.
    How to check: run lsof -p PID | grep java_pid
    If it lists a socket file, but the file does not exist, then this is exactly the described problem.
  2. JVM is started with -XX:+DisableAttachMechanism option.
  3. /tmp directory of Java process is not physically the same directory as /tmp of your shell, because Java is running in a container or in chroot environment. jattach attempts to solve this automatically, but it might lack the required permissions to do so.
    Check strace build/jattach PID properties
  4. JVM is busy and cannot reach a safepoint. For instance, JVM is in the middle of long-running garbage collection.
    How to check: run kill -3 PID. Healthy JVM process should print a thread dump and heap info in its console.
Failed to inject profiler into <pid>

The connection with the target JVM has been established, but JVM is unable to load profiler shared library. Make sure the user of JVM process has permissions to access libasyncProfiler.so by exactly the same absolute path. For more information see #78.

No access to perf events. Try --all-user option or 'sysctl kernel.perf_event_paranoid=1'

or

Perf events unavailable

perf_event_open() syscall has failed.

Typical reasons include:

  1. /proc/sys/kernel/perf_event_paranoid is set to restricted mode (>=2).
  2. seccomp disables perf_event_open API in a container.
  3. OS runs under a hypervisor that does not virtualize performance counters.
  4. perf_event_open API is not supported on this system, e.g. WSL.

If changing the configuration is not possible, you may fall back to -e itimer profiling mode. It is similar to cpu mode, but does not require perf_events support. As a drawback, there will be no kernel stack traces.

No AllocTracer symbols found. Are JDK debug symbols installed?

The OpenJDK debug symbols are required for allocation profiling. See Installing Debug Symbols for more details. If the error message persists after a successful installation of the debug symbols, it is possible that the JDK was upgraded when installing the debug symbols. In this case, profiling any Java process which had started prior to the installation will continue to display this message, since the process had loaded the older version of the JDK which lacked debug symbols. Restarting the affected Java processes should resolve the issue.

VMStructs unavailable. Unsupported JVM?

JVM shared library does not export gHotSpotVMStructs* symbols - apparently this is not a HotSpot JVM. Sometimes the same message can be also caused by an incorrectly built JDK (see #218). In these cases installing JDK debug symbols may solve the problem.

Could not parse symbols from <libname.so>

Async-profiler was unable to parse non-Java function names because of the corrupted contents in /proc/[pid]/maps. The problem is known to occur in a container when running Ubuntu with Linux kernel 5.x. This is the OS bug, see https://bugs.launchpad.net/ubuntu/+source/linux/+bug/1843018.

Could not open output file

Output file is written by the target JVM process, not by the profiler script. Make sure the path specified in -f option is correct and is accessible by the JVM.

Comments
  • Publish Jar (with embedded native agent) to Maven central

    Publish Jar (with embedded native agent) to Maven central

    Some ideas about the Java API:

    1. published to maven central, so it can be easily added as dependency in other Maven based projects.
    2. Jar contains libAsynProfiler.so(dylib) so that the jar can be used independently
    3. Java API execute() method supports 'file' argument (already committed)
    enhancement 
    opened by advancedxy 37
  • Unknown Java Frame on JDK-8180450 reproducer

    Unknown Java Frame on JDK-8180450 reproducer

    MInimal (benchmark) code to reproduce it using

    # JMH version: 1.35
    # VM version: JDK 11.0.16.1, OpenJDK 64-Bit Server VM, 11.0.16.1+1
    
    import org.openjdk.jmh.annotations.*;
    import org.openjdk.jmh.infra.Blackhole;
    
    import java.util.Objects;
    import java.util.concurrent.TimeUnit;
    
    @State(Scope.Thread)
    @Measurement(iterations = 10, time = 200, timeUnit = TimeUnit.MILLISECONDS)
    @Warmup(iterations = 10, time = 200, timeUnit = TimeUnit.MILLISECONDS)
    @OutputTimeUnit(TimeUnit.MICROSECONDS)
    @Fork(2)
    public class RequireNonNullCheckcastScalability {
        public interface InternalContext extends Context {
            // Internal Framework API
            boolean isDuplicated();
        }
    
        public interface Context {
            // some public API
        }
    
        public static class DuplicatedContext implements InternalContext {
    
    
            @Override
            public boolean isDuplicated() {
                return true;
            }
        }
    
        public static class NonDuplicatedContext implements InternalContext {
    
            @Override
            public boolean isDuplicated() {
                return false;
            }
        }
    
        private Context ctx;
    
        @Setup
        public void init(Blackhole bh) {
            ctx = new NonDuplicatedContext();
            // let's warm it enough to get it compiled with C2 (by default)
            for (int i = 0; i < 11000; i++) {
                bh.consume(isDuplicated());
            }
            // deopt on warmup
            ctx = new DuplicatedContext();
        }
    
        private static boolean isDuplicatedContext(Context message) {
            Context actual = Objects.requireNonNull(message);
            return ((InternalContext) actual).isDuplicated();
        }
    
        @Benchmark
        @Threads(2)
        @CompilerControl(CompilerControl.Mode.DONT_INLINE)
        public boolean isDuplicated() {
            return isDuplicatedContext(ctx);
        }
    }
    

    Flamegraph is image

    Reporting a huge number of unknown Java frames.

    perfasm shows that:

    ....[Hottest Region 1]..............................................................................
    c2, level 4, io.forked.franz.benchmarks.RequireNonNullCheckcastScalability::isDuplicated, version 2, compile id 546 
    
                       0x00007fc3dc300d44: shl    $0x3,%r10
                       0x00007fc3dc300d48: movabs $0x800000000,%r12
                       0x00007fc3dc300d52: add    %r12,%r10
                       0x00007fc3dc300d55: xor    %r12,%r12
                       0x00007fc3dc300d58: cmp    %r10,%rax
                       0x00007fc3dc300d5b: jne    0x00007fc3d484b080  ;   {runtime_call ic_miss_stub}
                       0x00007fc3dc300d61: data16 xchg %ax,%ax
                       0x00007fc3dc300d64: nopl   0x0(%rax,%rax,1)
                       0x00007fc3dc300d6c: data16 data16 xchg %ax,%ax
                     [Verified Entry Point]
       0.24%           0x00007fc3dc300d70: mov    %eax,-0x14000(%rsp)
       0.36%           0x00007fc3dc300d77: push   %rbp
                       0x00007fc3dc300d78: sub    $0x20,%rsp         ;*synchronization entry
                                                                     ; - io.forked.franz.benchmarks.RequireNonNullCheckcastScalability::isDuplicated@-1 (line 63)
       0.71%           0x00007fc3dc300d7c: mov    0xc(%rsi),%r11d    ;*getfield ctx {reexecute=0 rethrow=0 return_oop=0}
                                                                     ; - io.forked.franz.benchmarks.RequireNonNullCheckcastScalability::isDuplicated@1 (line 63)
                       0x00007fc3dc300d80: mov    0x8(%r12,%r11,8),%r10d  ; implicit exception: dispatches to 0x00007fc3dc300e58
       0.44%           0x00007fc3dc300d85: movabs $0x800000000,%rsi
                       0x00007fc3dc300d8f: lea    (%rsi,%r10,8),%rsi
       0.50%           0x00007fc3dc300d93: mov    0x20(%rsi),%r10
       2.87%           0x00007fc3dc300d97: movabs $0x840091818,%rax  ;   {metadata(&apos;io/forked/franz/benchmarks/RequireNonNullCheckcastScalability$Context&apos;)}
                       0x00007fc3dc300da1: cmp    %rax,%r10
              ╭        0x00007fc3dc300da4: jne    0x00007fc3dc300ddb  ;*checkcast {reexecute=0 rethrow=0 return_oop=0}
              │                                                      ; - io.forked.franz.benchmarks.RequireNonNullCheckcastScalability::isDuplicatedContext@4 (line 55)
              │                                                      ; - io.forked.franz.benchmarks.RequireNonNullCheckcastScalability::isDuplicated@4 (line 63)
       0.21%  │   ↗    0x00007fc3dc300da6: movabs $0x840091a18,%rax  ;   {metadata(&apos;io/forked/franz/benchmarks/RequireNonNullCheckcastScalability$InternalContext&apos;)}
              │   │    0x00007fc3dc300db0: cmp    %rax,%r10
              │╭  │    0x00007fc3dc300db3: jne    0x00007fc3dc300e0c
       0.03%  ││  │ ↗  0x00007fc3dc300db5: lea    (%r12,%r11,8),%rbp  ;*checkcast {reexecute=0 rethrow=0 return_oop=0}
              ││  │ │                                                ; - io.forked.franz.benchmarks.RequireNonNullCheckcastScalability::isDuplicatedContext@9 (line 56)
              ││  │ │                                                ; - io.forked.franz.benchmarks.RequireNonNullCheckcastScalability::isDuplicated@4 (line 63)
       0.41%  ││  │ │  0x00007fc3dc300db9: mov    0x8(%rbp),%r11d
       1.66%  ││  │ │  0x00007fc3dc300dbd: cmp    $0x80123c8,%r11d   ;   {metadata(&apos;io/forked/franz/benchmarks/RequireNonNullCheckcastScalability$DuplicatedContext&apos;)}
              ││╭ │ │  0x00007fc3dc300dc4: jne    0x00007fc3dc300e3c  ;*invokeinterface isDuplicated {reexecute=0 rethrow=0 return_oop=0}
              │││ │ │                                                ; - io.forked.franz.benchmarks.RequireNonNullCheckcastScalability::isDuplicatedContext@12 (line 56)
              │││ │ │                                                ; - io.forked.franz.benchmarks.RequireNonNullCheckcastScalability::isDuplicated@4 (line 63)
       0.62%  │││ │ │  0x00007fc3dc300dc6: mov    $0x1,%eax          ;*synchronization entry
              │││ │ │                                                ; - io.forked.franz.benchmarks.RequireNonNullCheckcastScalability::isDuplicatedContext@-1 (line 55)
              │││ │ │                                                ; - io.forked.franz.benchmarks.RequireNonNullCheckcastScalability::isDuplicated@4 (line 63)
              │││ │ │  0x00007fc3dc300dcb: add    $0x20,%rsp
              │││ │ │  0x00007fc3dc300dcf: pop    %rbp
       0.77%  │││ │ │  0x00007fc3dc300dd0: mov    0x108(%r15),%r10
              │││ │ │  0x00007fc3dc300dd7: test   %eax,(%r10)        ;   {poll_return}
       2.43%  │││ │ │  0x00007fc3dc300dda: retq   
       0.33%  ↘││ │ │  0x00007fc3dc300ddb: push   %rax
               ││ │ │  0x00007fc3dc300ddc: mov    %rax,%rax
               ││ │ │  0x00007fc3dc300ddf: mov    0x28(%rsi),%rdi
      20.88%   ││ │ │  0x00007fc3dc300de3: mov    (%rdi),%ecx
       1.18%   ││ │ │  0x00007fc3dc300de5: add    $0x8,%rdi
               ││ │ │  0x00007fc3dc300de9: test   %rax,%rax
               ││ │ │  0x00007fc3dc300dec: repnz scas %es:(%rdi),%rax
      11.16%   ││ │ │  0x00007fc3dc300def: pop    %rax
       2.72%   ││╭│ │  0x00007fc3dc300df0: jne    0x00007fc3dc300dfa
               ││││ │  0x00007fc3dc300df6: mov    %rax,0x20(%rsi)
       0.36%   ││↘╰ │  0x00007fc3dc300dfa: je     0x00007fc3dc300da6
               ││   │  0x00007fc3dc300dfc: mov    $0xffffffde,%esi
               ││   │  0x00007fc3dc300e01: mov    %r11d,%ebp
               ││   │  0x00007fc3dc300e04: data16 xchg %ax,%ax
               ││   │  0x00007fc3dc300e07: callq  0x00007fc3d4849e00  ; ImmutableOopMap{rbp=NarrowOop }
               ││   │                                                ;*checkcast {reexecute=0 rethrow=0 return_oop=0}
               ││   │                                                ; - io.forked.franz.benchmarks.RequireNonNullCheckcastScalability::isDuplicatedContext@4 (line 55)
               ││   │                                                ; - io.forked.franz.benchmarks.RequireNonNullCheckcastScalability::isDuplicated@4 (line 63)
               ││   │                                                ;   {runtime_call UncommonTrapBlob}
       0.18%   ↘│   │  0x00007fc3dc300e0c: push   %rax
                │   │  0x00007fc3dc300e0d: mov    %rax,%rax
                │   │  0x00007fc3dc300e10: mov    0x28(%rsi),%rdi
      20.08%    │   │  0x00007fc3dc300e14: mov    (%rdi),%ecx
       1.36%    │   │  0x00007fc3dc300e16: add    $0x8,%rdi
                │   │  0x00007fc3dc300e1a: test   %rax,%rax
       0.98%    │   │  0x00007fc3dc300e1d: repnz scas %es:(%rdi),%rax
      10.75%    │   │  0x00007fc3dc300e20: pop    %rax
       3.35%    │  ╭│  0x00007fc3dc300e21: jne    0x00007fc3dc300e2b
                │  ││  0x00007fc3dc300e27: mov    %rax,0x20(%rsi)
       0.44%    │  ↘╰  0x00007fc3dc300e2b: je     0x00007fc3dc300db5
                │      0x00007fc3dc300e2d: mov    $0xffffffde,%esi
                │      0x00007fc3dc300e32: mov    %r11d,%ebp
                │      0x00007fc3dc300e35: xchg   %ax,%ax
                │      0x00007fc3dc300e37: callq  0x00007fc3d4849e00  ; ImmutableOopMap{rbp=NarrowOop }
                │                                                    ;*checkcast {reexecute=0 rethrow=0 return_oop=0}
                │                                                    ; - io.forked.franz.benchmarks.RequireNonNullCheckcastScalability::isDuplicatedContext@9 (line 56)
                │                                                    ; - io.forked.franz.benchmarks.RequireNonNullCheckcastScalability::isDuplicated@4 (line 63)
                │                                                    ;   {runtime_call UncommonTrapBlob}
                ↘      0x00007fc3dc300e3c: cmp    $0x8012383,%r11d   ;   {metadata(&apos;io/forked/franz/benchmarks/RequireNonNullCheckcastScalability$NonDuplicatedContext&apos;)}
                       0x00007fc3dc300e43: jne    0x00007fc3dc300e4c
    ....................................................................................................
      85.02%  <total for region 1>
    

    The most of the cost is (as expected) while interacting with Klass::secondary_super_cache and Klass::secondary_supers (array's length read), that's the code injected by https://github.com/openjdk/jdk11/blob/37115c8ea4aff13a8148ee2b8832b20888a5d880/src/hotspot/cpu/x86/macroAssembler_x86.cpp#L5503

    How to improve the accuracy of the profiler's output? Is it AGCT to be blamed instead?

    Many thanks!!

    opened by franz1981 35
  • Wall-clock profiler - hangs JVM

    Wall-clock profiler - hangs JVM

    Java version: # java -version openjdk version "11.0.6" 2020-01-14 LTS OpenJDK Runtime Environment Corretto-11.0.6.10.1 (build 11.0.6+10-LTS) OpenJDK 64-Bit Server VM Corretto-11.0.6.10.1 (build 11.0.6+10-LTS, mixed mode)

    Tomcat server 9.0.33.0.

    after running wall clock profiler JVM hanged in such state that process was not killed and there was no coredump. This was production evironment, so we needed to resrtart application ASAP. What data can I gather when next time such hang occurs?

    Server didn't accept any connection from user perspective, neither http nor jmx.

    Profiler was started as agent and was managed by: profiler.sh start -e wall -o jfr -f <file> <pid> profiler.sh stop <pid> > /dev/null

    opened by krzysztofslusarski 32
  • Profile low-privileged processes with perf_events

    Profile low-privileged processes with perf_events

    Implements what's been discussed in #397 .

    General flow

    • The start operation now accepts a flag fdtransfer, which initializes the FdTransfer class (creates a UDS and waits for a connection).
    • Components in async-profiler can check in runtime whether we're connected with an FdTransfer peer, and if so, can send requests to that peer, instead of doing certain operations on their own.
    • "transferred" operations that we support are: the perf_event_open call, and obtaining a file descriptor of /proc/kallsyms.
    • profiler.sh accepts --fdtransfer which lets it start the fdtransfer program alongside with jattach. The fdtransfer program connects to the target async-profiler and serves all requests it receives, until async-profiler closes the peer socket (upon stop).

    Using this, I'm able to profile a low-privileged container, running test/Target.java and started this way: docker run --user 8888:8888 java ... with this command: sudo ./profiler.sh -d 2 -e cpu -f ... -o flamegraph --fdtransfer $(pgrep java) - and I get proper kernel stacks. On my box, perf_event_paranoid = 3 and kptr_restrict = 1.

    TODOs

    Got some small ones in the code, these are the major ones.

    • [x] ~~Base branch - I'm currently based on 5dd9e86a1d6cc7214a1ffabe322dc5bb99582554 (v1.8.4), on which should I rebase, master or v2.0?~~ I just saw that v2.0 is merged into master, so I'll rebase on master.
    • [x] ~~Decide on appropriate tests to add. I guess something like smoke-test.sh with fdtransfer, which proves that we get kernel stacks in addition to Java stacks.~~ Added a basic smoke test.
    • [ ] ~~I currently ignore PerfEvents::check (that is, I don't check for fdtransfer there). Do you think it's relevant?~~ I implemented this, but IIUC the purpose of the check action, I don't think it's very relevant. I can add it if you think it's useful.
    • [x] ~~Waiting for fdtransfer to exit? Currently it will connect to async-profiler and serve all requests until EOF (which happens upon stop). It works fine with the collect action. If running start directly, fdtransfer might need to be disowned so it continues executing after profiler.sh exits.~~ I run it without waiting for the collect action, because we run stop before exiting; for start & resume, I run it with nohup &.
    • [x] Update the readme & usage - https://github.com/jvm-profiling-tools/async-profiler#profiling-java-in-a-container and all parts that tell you to modify perf_event_paranoid and kptr_restrict, since it's not needed if using fdtransfer.

    Error handling:

    • [x] Got some cases where we might have truncated reads/writes, should be replaced with a "read all" / "write all" loops.
    • [x] ~~Use of perror / fprintf(stderr) in async-profiler side - is it legit? async-profiler already writes to the process' stderr, but perhaps not as verbose as I've been here...~~ Post-rebase and 7ec5c195e7ec4ad37d0673f6830a256c105721de, I'll use the new logger class.
    • [x] In case of errors with fdtransfer, I think the correct behavior should be as if the "original" (non-transferred) operation has failed. Make sure it's the case in all relevant sites.

    Notes

    • I made FdTransfer a static class, because it's simpler, and I don't see how we'll ever need more than 1 instance. Plus, in most of async-profiler code we already use such singletons.
    • In general I'm more of a C guy, so the C++ might be a bit too C-ish, I'll be happy to improve any areas that you think are too much C, if you care about it.
    • Upon the first fdtransfer usage in async-profiler, the listener socket remains open (and further invocations of start,fdtransfer will use it). This implicitly "solves" https://github.com/jvm-profiling-tools/async-profiler/issues/395 because the listener socket acts as a mutex.
    • I took efforts to write the FdTransfer class in a way it's easier to add new "request types", because I already have some ideas that can be added after this PR:
      • Use it to pass the fd of the output file - this way, the output file can be written "in the host" and not in the mount namespace where async-profiler runs (#353)
      • ~~I think it'd be nice to change async-profiler to write all errors & warning to a separate file (instead of the process' stderr). This will be much more convenient when checking for errors. If we make this change -~~ (this change was done on master already) we can, again, pass the fd of this "error file" to async-profiler, so its output is written "in the host".
      • This "protocol" can also be used to stream events (https://github.com/jvm-profiling-tools/async-profiler/issues/404), or at least, to pass a file descriptor on which you stream the events.
    opened by Jongy 28
  • Wall-clock profiling

    Wall-clock profiling

    It may be helpful to measure not only the time that method spent consuming the CPU but also the time method was waiting for lock or I/O. Please implement 'wall clock' profiling mode.

    enhancement 
    opened by ksafonov 28
  • JVM Crashed with segfault and hs_err_pid

    JVM Crashed with segfault and hs_err_pid

    Stack: [0x00007f090f348000,0x00007f090f449000], sp=0x00007f090f445320, free space=1012k Native frames: (J=compiled Java code, j=interpreted, Vv=VM code, C=native code) V [libjvm.so+0x1f5c1e] V [libjvm.so+0x58b4cf] AsyncGetCallTrace+0x1cf C [profiler16367091390978467745864966299567.so+0x36a88] Profiler::getJavaTraceAsync(void*, ASGCT_CallFrame*, int)+0xd8 C [profiler16367091390978467745864966299567.so+0x37362] Profiler::recordSample(void*, unsigned long long, int, Event*)+0xd2 C [profiler16367091390978467745864966299567.so+0x33594] PerfEvents::signalHandler(int, siginfo*, void*)+0x144 C [libc.so.6+0x3f040] C [linux-vdso.so.1+0x982] clock_gettime+0x32 C [libc.so.6+0x130d36] __clock_gettime+0x26 v ~StubRoutines::call_stub C 0x0000000668be5868

    jvm bug 
    opened by toktarev 27
  • jattach hangs

    jattach hangs

    Hi,

    I'm not sure if I'm misusing the profiler, but since my production is running on a peculiar setup I'd rather ask.

    I'm trying to test the profiler on live application, using the script (so using the jattach mechanism).

    The service runs on a kubernetes and rocket as the container engine.

    kubectl --context=prod exec -it --container=c edited-pod-name -- bash
    

    From this moment assume the commands are run within this container :

    root@edited-pod-name:/profile# uname -a
    Linux edited-pod-name 4.14.19-coreos #1 SMP Wed Feb 14 03:18:05 UTC 2018 x86_64 GNU/Linux
    
    java -version
    root@edited-pod-name:/profile# openjdk version "1.8.0_202"
    OpenJDK Runtime Environment Corretto-8.202.08.2 (build 1.8.0_202-b08)
    OpenJDK 64-Bit Server VM Corretto-8.202.08.2 (build 25.202-b08, mixed mode)
    
    root@edited-pod-name:/profile# ./profiler.sh --version
    Async-profiler 1.5 built on Jan 25 2019
    Copyright 2018 Andrei Pangin
    
    root@edited-pod-name:/profile# whoami
    root
    

    Following the readme, I just ran this command :

    root@edited-pod-name:/profile# ./profiler.sh -d 30 -f profile.svg 526
    

    However nothing happens, there's no error, the script just hangs, I'm forced to stop the script with the usual ctrl-c.

    root@edited-pod-name:/profile# date +"%A, %m %d %Y %H:%M:%S"; ./profiler.sh -d 10 -f profile.svg 526
    Monday, 05 27 2019 17:40:55
    ^C
    root@edited-pod-name:/profile# date +"%A, %m %d %Y %H:%M:%S";
    Monday, 05 27 2019 17:41:15
    

    I wasn't sure about the perf event, so I blindly tried the fallback -e itimer without help.

    Even a simple list do not work

    root@edited-pod-name:/profile# ./profiler.sh list 526
    ^C
    
    JVM flags and `ps` information
    root@edited-pod-name:/profile# jinfo -flags 526
    Attaching to process ID 526, please wait...
    Debugger attached successfully.
    Server compiler detected.
    JVM version is 25.202-b08
    Non-default VM flags: -XX:CICompilerCount=15 -XX:CompressedClassSpaceSize=192937984 -XX:GCLogFileSize=10485760 -XX:InitialHeapSize=2147483648 -XX:+ManagementServer -XX:MaxHeapSize=2147483648 -XX:MaxMetaspaceSize=201326592 -XX:MaxNewSize=715653120 -XX:MinHeapDeltaBytes=524288 -XX:NewSize=715653120 -XX:NumberOfGCLogFiles=5 -XX:OldSize=1431830528 -XX:+PrintGC -XX:+PrintGCApplicationConcurrentTime -XX:+PrintGCApplicationStoppedTime -XX:+PrintGCCause -XX:+PrintGCDateStamps -XX:+PrintGCDetails -XX:+PrintGCTimeStamps -XX:+PrintTenuringDistribution -XX:+UseCompressedClassPointers -XX:+UseCompressedOops -XX:+UseGCLogFileRotation -XX:+UseParallelGC
    Command line:  -Dfile.encoding=UTF-8 -Duser.timezone=UTC -Dcom.sun.management.jmxremote.port=7199 -Dcom.sun.management.jmxremote.rmi.port=7199 -Dcom.sun.management.jmxremote.ssl=false -Dcom.sun.management.jmxremote.authenticate=false -Djava.security.egd=file:/dev/./urandom -Dlogging.config=/logback.xml -Xms2g -Xmx2g -XX:MaxMetaspaceSize=192m -XX:+PrintGCDetails -XX:+PrintGCApplicationStoppedTime -XX:+PrintGCApplicationConcurrentTime -XX:+PrintGCDateStamps -XX:+PrintTenuringDistribution -XX:+PrintGCCause -XX:+UseGCLogFileRotation -XX:NumberOfGCLogFiles=5 -XX:GCLogFileSize=10M -Xloggc:/gclogs/2019-05-27T15-46-22-gc.log -javaagent:/newrelic-agent.jar -javaagent:/sqreen-agent.jar -Dsqreen.config_file=/sqreen.properties
    
    root@edited-pod-name:/profile# ps -fl -p 526
    F S UID        PID  PPID  C PRI  NI ADDR SZ WCHAN  STIME TTY          TIME CMD
    0 S root       526   458 11  80   0 - 7487258 -    15:46 ?        00:17:40 /usr/local/bin/java -Dfile.encoding=UTF-8 -Duser.timezone=UTC -Dcom.sun.management.jmxremote.port=7199 -Dcom.sun.management.jmxremote.rmi.port=7199 -Dcom.sun.management.jmxremote.ssl=false -Dcom.sun.management.jmxremote.authenticate=false -Djava.security.egd=file:/dev/./urandom -Dlogging.config=/logback.xml -Xms2g -Xmx2g -XX:MaxMetaspaceSize=192m -XX:+PrintGCDetails -XX:+PrintGCApplicationStoppedTime -XX:+PrintGCApplicationConcurrentTime -XX:+PrintGCDateStamps -XX:+PrintTenuringDistribution -XX:+PrintGCCause -XX:+UseGCLogFileRotation -XX:NumberOfGCLogFiles=5 -XX:GCLogFileSize=10M -Xloggc:/gclogs/2019-05-27T15-46-22-gc.log -javaagent:/newrelic-agent.jar -javaagent:/sqreen-agent.jar -Dsqreen.config_file=/sqreen.properties -jar /edge-api.jar --spring.config.location=/config.yml
    
    Supported events
    /# ./profiler.sh list jps
    Basic events:
      cpu
      alloc
      lock
      wall
      itimer
    Perf events:
      page-faults
      context-switches
      cycles
      instructions
      cache-references
      cache-misses
      branches
      branch-misses
      bus-cycles
      L1-dcache-load-misses
      LLC-load-misses
      dTLB-load-misses
      mem:breakpoint
      trace:tracepoint
    

    What can I do to help. Warning this a slippery area for me.

    opened by bric3 27
  • Support multiple events at the same time

    Support multiple events at the same time

    Is it possible that async-profiler supports sampling on multiple events at the same time?

    I have checked the code. I plan to change the function Error PerfEvents::start(const char* event, long interval) in async-profiler/src/perfEvents_linux.cpp, make it first parse the event string into a list (maybe separated by ","), then run the current procedure for each event in the list.

    Is it Ok? Any suggestions?

    enhancement 
    opened by t1mch0w 25
  • How to use the option --fdtransfer for profiling from the host

    How to use the option --fdtransfer for profiling from the host

    Hi ,

    While searching for an option to execute the profiler from the host we found an new option --fdtransfer.

    When we tried that option on our host

    sudo -u username ./profiler.sh -e cpu -d 30 --fdtransfer -f /tmp/sample.html we encountered Unrecognized option: --fdtransfer we used both 1.8.6 and 2.0 versions of async-profiler We arent sure whether the approach is correct is their any pre-requisite required could you guide us. Thanks in advance

    question 
    opened by sattishv 22
  • Fresh segfault

    Fresh segfault

    Stack: [0x00007fb3fb887000,0x00007fb3fb988000],  sp=0x00007fb3fb9857f8,  free space=1017k
    Native frames: (J=compiled Java code, j=interpreted, Vv=VM code, C=native code)
    j  org.apache.spark.SomeRDD$$anon$1.<init>(Lorg/apache/spark/SomeRDD;Lorg/apache/spark/TaskContext;Lorg/apache/spark/Partition;)V+431
    j  org.apache.spark.SomeRDD.compute(Lorg/apache/spark/Partition;Lorg/apache/spark/TaskContext;)Lscala/collection/Iterator;+27
    j  org.apache.spark.rdd.RDD.computeOrReadCheckpoint(Lorg/apache/spark/Partition;Lorg/apache/spark/TaskContext;)Lscala/collection/Iterator;+26
    j  org.apache.spark.rdd.RDD.iterator(Lorg/apache/spark/Partition;Lorg/apache/spark/TaskContext;)Lscala/collection/Iterator;+42


    @krzysztofslusarski gave me advice about wall mode

    safemode=64,event=wall,thread,interval=1000000,jfr

    caused segfault

    opened by toktarev 20
  • Correlate with Java threads

    Correlate with Java threads

    First of all, thanks for this awesome library!

    I'm trying to correlate stack traces with Java threads. However, the thread ids reported by async-profiler are the native thread ids which are not equal to Java thread ids.

    Async-profiler reports the thread name which matches with java.lang.Thread::getName. However, not all threads seem to have a name attached to them. See the else block here:

    https://github.com/jvm-profiling-tools/async-profiler/blob/2557363892b7f83dec4c652ca1b19e50e21877e4/src/frameName.cpp#L165-L169

    My question is why is the thread name unknown sometimes and in which cases? The thread name seems to be mandatory at the Java level.

    opened by felixbarny 19
  • Large flame graphs not user friendly

    Large flame graphs not user friendly

    When generating large flame graphs with many stack traces, the UI elements (mainly the search and status with number of samples) are not user friendly because they are at the edge of the HTML. i.e. you would have to scroll all the way up to use the search function, and have to scroll all the way down to even see the status. Moreover, you can't see the status for elements that are high up in the flame graph because the status bar is always at the bottom of the page.

    image image
    opened by Cheejyg 0
  • Used the same libasyncProfiler.so to profile event alloc twice in different the path,the second time failed with “[ERROR] Could not set dlopen hook”

    Used the same libasyncProfiler.so to profile event alloc twice in different the path,the second time failed with “[ERROR] Could not set dlopen hook”

    Hi Team; env:

    • OS is Debian 9
    • java -version is openjdk 1.8.0_352
    • async-profiler is latest v2.9

    when we used the same libasyncProfiler.soto profile event alloc twice in defferent path

    1. at first command ./profiler.sh -d 5 -e alloc 2735959 everything would be ok,and the process has loaded the libasyncProfiler.so correctly。
    2. i remove the original libasyncProfiler.so ,and build it in another directory.
    3. at second time command ./profiler.sh -d 5 -e alloc 2735959 failed with “[ERROR] Could not set dlopen hook”
    Connected to remote JVM
    JVM response code = 0
    200
    
    [ERROR] Could not set dlopen hook. Unsupported JVM?
    
    1. cat /proc/PID/smaps | grep libasyncProfiler.so
    7fbeb6414000-7fbeb645b000 r-xp 00000000 08:10 4072470                    /2/async_profiler/build/libasyncProfiler.so
    7fbeb645b000-7fbeb665b000 ---p 00047000 08:10 4072470                    /2/async_profiler/build/libasyncProfiler.so
    7fbeb665b000-7fbeb665c000 r--p 00047000 08:10 4072470                    /2/async_profiler/build/libasyncProfiler.so
    7fbeb665c000-7fbeb665d000 rw-p 00048000 08:10 4072470                   /2/async_profiler/build/libasyncProfiler.so
    7fbeba819000-7fbeba860000 r-xp 00000000 08:10 4072254                    /1/as/build/libasyncProfiler.so (deleted)
    7fbeba860000-7fbebaa60000 ---p 00047000 08:10 4072254                    /1/as/build/libasyncProfiler.so (deleted)
    7fbebaa60000-7fbebaa61000 r--p 00047000 08:10 4072254                    /1/as/build/libasyncProfiler.so (deleted)
    7fbebaa61000-7fbebaa62000 rw-p 00048000 08:10 4072254                    /1/as/build/libasyncProfiler.so (deleted)
    
    opened by zangcq 2
  • mprotect graph has huge

    mprotect graph has huge "_mprotect" section

    We noticed a bump in RSS usage around the time we profiled the process for 'mprotect' event. The majority of the graph was filled with just a "mprotect" function call. What do we make out of it? Screen Shot 2022-12-15 at 2 01 30 PM

    opened by pmaru10 8
  • On JDK8, alloc tracing may cause heap corrupt and crash

    On JDK8, alloc tracing may cause heap corrupt and crash

    hi, Andrei

    One of our applications has been running stably for more than 3 years. Recently, we used async-profiler to continuously trace the cpu and alloc of the application, and found that it would crash every once in a while (it may be 1 hour after startup, or it may be 1 day later, the time is not very sure). If turn off alloc and only turn on cpu tracing, every thing goes well, never crash again.

    java version "1.8.0_202" Java(TM) SE Runtime Environment (build 1.8.0_202-b08) Java HotSpot(TM) 64-Bit Server VM (build 25.202-b08, mixed mode)

    OracleJDK hs_err_pid15474.log OpenJDK hs_err_pid4529.log

    OpenJDK hs_err_pid4529.log RDI=0x00000000877bbf60 is pointing into object: 0x00000000877bbf58 java.util.concurrent.ConcurrentHashMap$Node

    • klass: 'java/util/concurrent/ConcurrentHashMap$Node'
    #0  0x00007f8c550e81d7 in __GI_raise (sig=sig@entry=6) at ../nptl/sysdeps/unix/sysv/linux/raise.c:56
    #1  0x00007f8c550e98c8 in __GI_abort () at abort.c:90
    #2  0x00007f8c549fe109 in os::abort (dump_core=<optimized out>) at /home/yibo.yl/openjdk/jdk8u/hotspot/src/os/linux/vm/os_linux.cpp:1565
    #3  0x00007f8c54b97186 in VMError::report_and_die (this=this@entry=0x7f8c52f22920) at /home/yibo.yl/openjdk/jdk8u/hotspot/src/share/vm/utilities/vmError.cpp:1107
    #4  0x00007f8c54a07bbf in JVM_handle_linux_signal (sig=11, info=0x7f8c52f22bb0, ucVoid=0x7f8c52f22a80, abort_if_unrecognized=<optimized out>) at /home/yibo.yl/openjdk/jdk8u/hotspot/src/os_cpu/linux_x86/vm/os_linux_x86.cpp:541
    #5  0x00007f8c549fb5a8 in signalHandler (sig=11, info=0x7f8c52f22bb0, uc=0x7f8c52f22a80) at /home/yibo.yl/openjdk/jdk8u/hotspot/src/os/linux/vm/os_linux.cpp:4538
    #6  <signal handler called>
    #7  0x00007f8c547a1fe1 in oopDesc::size_given_klass (this=0x877bbf60, klass=0x474ae0140) at /home/yibo.yl/openjdk/jdk8u/hotspot/src/share/vm/oops/oop.inline.hpp:405
    #8  0x00007f8c54796a16 in do_oop_work<unsigned int> (gc_barrier=true, root_scan=false, p=0x9593df14, this=0x7f8b380938f0) at /home/yibo.yl/openjdk/jdk8u/hotspot/src/share/vm/gc_implementation/parNew/parOopClosures.inline.hpp:118
    #9  do_oop_nv (p=0x9593df14, this=0x7f8b380938f0) at /home/yibo.yl/openjdk/jdk8u/hotspot/src/share/vm/gc_implementation/parNew/parOopClosures.inline.hpp:139
    #10 InstanceKlass::oop_oop_iterate_nv (this=0x100001610, obj=0x9593df08, closure=0x7f8b380938f0) at /home/yibo.yl/openjdk/jdk8u/hotspot/src/share/vm/oops/instanceKlass.cpp:2352
    #11 0x00007f8c54a1e75e in oop_iterate (blk=0x7f8b380938f0, this=<optimized out>) at /home/yibo.yl/openjdk/jdk8u/hotspot/src/share/vm/oops/oop.inline.hpp:734
    #12 ParScanThreadState::trim_queues (this=0x7f8b380937f0, max_size=20) at /home/yibo.yl/openjdk/jdk8u/hotspot/src/share/vm/gc_implementation/parNew/parNewGeneration.cpp:175
    #13 0x00007f8c54a215e7 in do_oop_work<unsigned int> (root_scan=true, gc_barrier=true, p=0x89890404, this=<optimized out>) at /home/yibo.yl/openjdk/jdk8u/hotspot/src/share/vm/gc_implementation/parNew/parOopClosures.inline.hpp:125
    #14 ParRootScanWithBarrierTwoGensClosure::do_oop (this=0x7f8b380939a0, p=0x89890404) at /home/yibo.yl/openjdk/jdk8u/hotspot/src/share/vm/gc_implementation/parNew/parNewGeneration.cpp:506
    #15 0x00007f8c549da0e9 in do_oop_work<unsigned int> (this=<optimized out>, this=<optimized out>, p=0x89890404) at /home/yibo.yl/openjdk/jdk8u/hotspot/src/share/vm/memory/genOopClosures.hpp:165
    #16 do_oop_nv (p=0x89890404, this=<optimized out>) at /home/yibo.yl/openjdk/jdk8u/hotspot/src/share/vm/memory/genOopClosures.hpp:176
    #17 ObjArrayKlass::oop_oop_iterate_nv_m (this=<optimized out>, obj=0x8988a508, closure=0x7f8c52f23970, mr=...) at /home/yibo.yl/openjdk/jdk8u/hotspot/src/share/vm/oops/objArrayKlass.cpp:557
    #18 0x00007f8c545f827b in oop_iterate (mr=..., blk=0x7f8c52f23970, this=0x8988a508) at /home/yibo.yl/openjdk/jdk8u/hotspot/src/share/vm/oops/oop.inline.hpp:734
    #19 FreeListSpace_DCTOC::walk_mem_region_with_cl_par (this=0x7f8b280c1190, mr=..., bottom=0x8988a508, top=0x89890800, cl=0x7f8c52f23970) at /home/yibo.yl/openjdk/jdk8u/hotspot/src/share/vm/gc_implementation/concurrentMarkSweep/compactibleFreeListSpace.cpp:751
    #20 0x00007f8c545f919d in FreeListSpace_DCTOC::walk_mem_region_with_cl (this=<optimized out>, mr=..., bottom=<optimized out>, top=<optimized out>, cl=<optimized out>) at /home/yibo.yl/openjdk/jdk8u/hotspot/src/share/vm/gc_implementation/concurrentMarkSweep/compactibleFreeListSpace.cpp:751
    #21 0x00007f8c54ac2798 in Filtering_DCTOC::walk_mem_region (this=<optimized out>, mr=..., bottom=<optimized out>, top=<optimized out>) at /home/yibo.yl/openjdk/jdk8u/hotspot/src/share/vm/memory/space.cpp:226
    #22 0x00007f8c54ac21dc in DirtyCardToOopClosure::do_MemRegion (this=0x7f8b280c1190, mr=...) at /home/yibo.yl/openjdk/jdk8u/hotspot/src/share/vm/memory/space.cpp:171
    #23 0x00007f8c5457da06 in ClearNoncleanCardWrapper::do_MemRegion (this=this@entry=0x7f8c52f23b10, mr=...) at /home/yibo.yl/openjdk/jdk8u/hotspot/src/share/vm/memory/cardTableRS.cpp:212
    #24 0x00007f8c54a18fa7 in CardTableModRefBS::process_stride (this=this@entry=0x7f8c4c0202d0, sp=sp@entry=0x7f8c4c022c90, used=..., stride=<optimized out>, n_strides=n_strides@entry=4, cl=cl@entry=0x7f8b380939a0, ct=ct@entry=0x7f8c4c020290, lowest_non_clean=0x7f8c3c14b560,
        lowest_non_clean_base_chunk_index=547815073504, lowest_non_clean_chunk_size=10697) at /home/yibo.yl/openjdk/jdk8u/hotspot/src/share/vm/gc_implementation/parNew/parCardTableModRefBS.cpp:159
    #25 0x00007f8c54a1952b in CardTableModRefBS::non_clean_card_iterate_parallel_work (this=0x7f8c4c0202d0, sp=sp@entry=0x7f8c4c022c90, mr=..., cl=cl@entry=0x7f8b380939a0, ct=ct@entry=0x7f8c4c020290, n_threads=<optimized out>)
        at /home/yibo.yl/openjdk/jdk8u/hotspot/src/share/vm/gc_implementation/parNew/parCardTableModRefBS.cpp:74
    #26 0x00007f8c5457d597 in CardTableModRefBS::non_clean_card_iterate_possibly_parallel (this=<optimized out>, sp=sp@entry=0x7f8c4c022c90, mr=..., cl=cl@entry=0x7f8b380939a0, ct=ct@entry=0x7f8c4c020290) at /home/yibo.yl/openjdk/jdk8u/hotspot/src/share/vm/memory/cardTableModRefBS.cpp:485
    #27 0x00007f8c5457d809 in CardTableRS::younger_refs_in_space_iterate (this=0x7f8c4c020290, sp=0x7f8c4c022c90, cl=0x7f8b380939a0) at /home/yibo.yl/openjdk/jdk8u/hotspot/src/share/vm/memory/cardTableRS.cpp:311
    #28 0x00007f8c54634b5e in ConcurrentMarkSweepGeneration::younger_refs_iterate (this=<optimized out>, cl=0x7f8b380939a0) at /home/yibo.yl/openjdk/jdk8u/hotspot/src/share/vm/gc_implementation/concurrentMarkSweep/concurrentMarkSweepGeneration.cpp:3199
    #29 0x00007f8c5473e928 in GenCollectedHeap::gen_process_roots (this=this@entry=0x7f8c4c019c00, level=<optimized out>, younger_gens_as_roots=younger_gens_as_roots@entry=true, activate_scope=activate_scope@entry=false, so=so@entry=GenCollectedHeap::SO_ScavengeCodeCache,
        only_strong_roots=only_strong_roots@entry=false, not_older_gens=not_older_gens@entry=0x7f8b38093948, older_gens=older_gens@entry=0x7f8b380939a0, cld_closure=cld_closure@entry=0x7f8c52f23df0) at /home/yibo.yl/openjdk/jdk8u/hotspot/src/share/vm/memory/genCollectedHeap.cpp:740
    #30 0x00007f8c54a1b88d in ParNewGenTask::work (this=0x7f8c5012a6b0, worker_id=<optimized out>) at /home/yibo.yl/openjdk/jdk8u/hotspot/src/share/vm/gc_implementation/parNew/parNewGeneration.cpp:629
    #31 0x00007f8c54bad1ea in GangWorker::loop (this=0x7f8c4c01e800) at /home/yibo.yl/openjdk/jdk8u/hotspot/src/share/vm/utilities/workgroup.cpp:329
    #32 0x00007f8c549fd222 in java_start (thread=0x7f8c4c01e800) at /home/yibo.yl/openjdk/jdk8u/hotspot/src/os/linux/vm/os_linux.cpp:840
    #33 0x00007f8c55896dc5 in start_thread (arg=0x7f8c52f24700) at pthread_create.c:308
    #34 0x00007f8c551aa76d in clone () at ../sysdeps/unix/sysv/linux/x86_64/clone.S:113
    

    (gdb) x/16wx 0x9593df08 (an oop) 0x9593df08: 0x00000007 0x00000000 0x200002c2 0x877bbf60 0x9593df18: 0x00000000 0x00000000 0x0000000d 0x00000000 0x9593df28: 0x2000ac29 0x00000000 0xe2a6fb68 0x00000184 0x9593df38: 0x0000000d 0x00000000 0x200002c2 0x935a3288

    (gdb) x/16wx (0x200002c2l << 3) java.lang.String 0x100001610: 0x55037430 0x00007f8c 0x00000018 0x00000030 (address of char[]) 0x100001620: 0x55ae4100 0x00007f8c 0x00001260 0x00000001 0x100001630: 0x398020a0 0x00007f8c 0x00000ea8 0x00000001 0x100001640: 0x00001610 0x00000001 0x00000000 0x00000000

    (gdb) x/64bc 0x00007f8c55ae4100 0x7f8c55ae4100: 16 '\020' 0 '\000' -1 '\377' -1 '\377' -17 '\357' 122 'z' 117 'u' 48 '0' 0x7f8c55ae4108: 106 'j' 97 'a' 118 'v' 97 'a' 47 '/' 108 'l' 97 'a' 110 'n' 0x7f8c55ae4110: 103 'g' 47 '/' 83 'S' 116 't' 114 'r' 105 'i' 110 'n' 103 'g' 0x7f8c55ae4118: 0 '\000' 0 '\000' 0 '\000' 0 '\000' 0 '\000' 0 '\000' 0 '\000' 0 '\000' 0x7f8c55ae4120: 16 '\020' 0 '\000' -1 '\377' -1 '\377' -61 '\303' -7 '\371' -39 '\331' 112 'p' 0x7f8c55ae4128: 106 'j' 97 'a' 118 'v' 97 'a' 47 '/' 108 'l' 97 'a' 110 'n' 0x7f8c55ae4130: 103 'g' 47 '/' 84 'T' 104 'h' 114 'r' 101 'e' 97 'a' 100 'd' 0x7f8c55ae4138: 0 '\000' 0 '\000' 0 '\000' 0 '\000' 0 '\000' 0 '\000' 0 '\000' 0 '\000'

    (gdb) x/32wx 0x877bbf30 (0x877bbf60 should point to char[], but actually points into oop, which means the heap is corrupted) 0x877bbf30: 0x8d846ee0 0x8d846ee0 0x8bb317a0 0x8d326f68 0x877bbf40: 0x8d326f80 0x89c27740 0x89c27740 0x899ff620 0x877bbf50: 0x899ff620 0x00000000 0x88716033 0x00000000 0x877bbf60: 0x2000674c 0x4d15b72b 0x8e95c028 0x877bbf10 0x877bbf70: 0x00000000 0x00000000 0x00000005 0x00000000 0x877bbf80: 0x2012ec84 0x00000080 0x00000080 0x00000080 0x877bbf90: 0x00000080 0x93806ff0 0x00000000 0x93941db8 0x877bbfa0: 0xb3fe8b08 0x00000000 0x88716243 0x00000000

    In order to further locate the reason, D-D-H and I add some debug code to OpenJDK. If in send_allocation_outside_tlab_event or send_allocation_in_new_tlab_event, and a safepoint occurs, triggering core dump. Finally we found that JvmtiEnv::GetStackTrace may enter safepoint, the memory corresponding to the tlab address allocated by the current thread may be allocated to other threads after GC, resulting in Heap corruption.

    https://github.com/openjdk/jdk8u.git commit 04a31b454cd853fb88aafffd411dd113e3f4045f (tag: jdk8u202-b08)

    pid31086.bt.log

    Thread 264 (Thread 0x7f7d36d75700 (LWP 31772)):
    #0  pthread_cond_wait@@GLIBC_2.3.2 () at ../nptl/sysdeps/unix/sysv/linux/x86_64/pthread_cond_wait.S:185
    #1  0x00007f7f631eef8b in os::PlatformEvent::park (this=this@entry=0x7f7d40014c00) at /home/yibo.yl/openjdk/jdk8u/hotspot/src/os/linux/vm/os_linux.cpp:5980
    #2  0x00007f7f631a8fa8 in ParkCommon (timo=0, ev=<optimized out>) at /home/yibo.yl/openjdk/jdk8u/hotspot/src/share/vm/runtime/mutex.cpp:424
    #3  Monitor::ILock (this=0x7f7f5c009530, Self=0x7f7d401a9800) at /home/yibo.yl/openjdk/jdk8u/hotspot/src/share/vm/runtime/mutex.cpp:491
    #4  0x00007f7f631a98f6 in lock_without_safepoint_check (Self=0x7f7d401a9800, this=0x7f7f5c009530) at /home/yibo.yl/openjdk/jdk8u/hotspot/src/share/vm/runtime/mutex.cpp:959
    #5  Monitor::lock_without_safepoint_check (this=0x7f7f5c009530) at /home/yibo.yl/openjdk/jdk8u/hotspot/src/share/vm/runtime/mutex.cpp:965
    #6  0x00007f7f63283e46 in SafepointSynchronize::block (thread=0x7f7d401a9800) at /home/yibo.yl/openjdk/jdk8u/hotspot/src/share/vm/runtime/safepoint.cpp:708
    #7  0x00007f7f631a97db in transition_and_fence (to=_thread_in_vm, from=_thread_blocked, thread=0x7f7d401a9800) at /home/yibo.yl/openjdk/jdk8u/hotspot/src/share/vm/runtime/interfaceSupport.hpp:184
    #8  trans_and_fence (to=_thread_in_vm, from=_thread_blocked, this=<synthetic pointer>) at /home/yibo.yl/openjdk/jdk8u/hotspot/src/share/vm/runtime/interfaceSupport.hpp:232
    #9  ~ThreadBlockInVM (this=<synthetic pointer>, __in_chrg=<optimized out>) at /home/yibo.yl/openjdk/jdk8u/hotspot/src/share/vm/runtime/interfaceSupport.hpp:314
    #10 Monitor::lock (this=this@entry=0x7f7f5c008c30, Self=0x7f7d401a9800) at /home/yibo.yl/openjdk/jdk8u/hotspot/src/share/vm/runtime/mutex.cpp:940
    #11 0x00007f7f631a98ab in Monitor::lock (this=this@entry=0x7f7f5c008c30) at /home/yibo.yl/openjdk/jdk8u/hotspot/src/share/vm/runtime/mutex.cpp:949
    #12 0x00007f7f62f87585 in MutexLocker (mutex=0x7f7f5c008c30, this=<synthetic pointer>) at /home/yibo.yl/openjdk/jdk8u/hotspot/src/share/vm/runtime/mutexLocker.hpp:185
    #13 InstanceKlass::get_jmethod_id (ik_h=..., method_h=...) at /home/yibo.yl/openjdk/jdk8u/hotspot/src/share/vm/oops/instanceKlass.cpp:1778
    #14 0x00007f7f63075b9c in jmethod_id (this=0x7f7eb4ebfa88) at /home/yibo.yl/openjdk/jdk8u/hotspot/src/share/vm/oops/method.hpp:776
    #15 JvmtiEnvBase::get_stack_trace (this=<optimized out>, java_thread=java_thread@entry=0x7f7d401a9800, start_depth=<optimized out>, max_count=max_count@entry=2048, frame_buffer=frame_buffer@entry=0x7f7ef404e930, count_ptr=count_ptr@entry=0x7f7d36d72730, this=<optimized out>) at /home/yibo.yl/openjdk/jdk8u/hotspot/src/share/vm/prims/jvmtiEnvBase.cpp:874
    #16 0x00007f7f6306be14 in JvmtiEnv::GetStackTrace (this=0x0, java_thread=0x7f7d401a9800, start_depth=0, max_frame_count=2048, frame_buffer=0x7f7ef404e930, count_ptr=0x7f7d36d72730) at /home/yibo.yl/openjdk/jdk8u/hotspot/src/share/vm/prims/jvmtiEnv.cpp:1303
    #17 0x00007f7f1a796c5b in Profiler::recordSample(void*, unsigned long long, int, Event*) () from /tmp/libasyncProfiler7868072734751652305.so
    #18 0x00007f7f1a797b4b in AllocTracer::recordAllocation(void*, int, unsigned long, unsigned long, unsigned long) () from /tmp/libasyncProfiler7868072734751652305.so
    #19 <signal handler called>
    #20 CollectedHeap::allocate_from_tlab_slow (klass=..., klass@entry=..., thread=thread@entry=0x7f7d401a9800, size=size@entry=4) at /home/yibo.yl/openjdk/jdk8u/hotspot/src/share/vm/gc_interface/collectedHeap.cpp:300
    #21 0x00007f7f62f83a9e in allocate_from_tlab (size=4, thread=0x7f7d401a9800, klass=...) at /home/yibo.yl/openjdk/jdk8u/hotspot/src/share/vm/gc_interface/collectedHeap.inline.hpp:236
    #22 common_mem_allocate_noinit (__the_thread__=0x7f7d401a9800, size=4, klass=...) at /home/yibo.yl/openjdk/jdk8u/hotspot/src/share/vm/gc_interface/collectedHeap.inline.hpp:131
    #23 common_mem_allocate_init (__the_thread__=0x7f7d401a9800, size=4, klass=...) at /home/yibo.yl/openjdk/jdk8u/hotspot/src/share/vm/gc_interface/collectedHeap.inline.hpp:223
    #24 obj_allocate (__the_thread__=0x7f7d401a9800, size=4, klass=...) at /home/yibo.yl/openjdk/jdk8u/hotspot/src/share/vm/gc_interface/collectedHeap.inline.hpp:251
    #25 InstanceKlass::allocate_instance (this=this@entry=0x100033a60, __the_thread__=__the_thread__@entry=0x7f7d401a9800) at /home/yibo.yl/openjdk/jdk8u/hotspot/src/share/vm/oops/instanceKlass.cpp:1150
    #26 0x00007f7f63280575 in OptoRuntime::new_instance_C (klass=0x100033a60, thread=0x7f7d401a9800) at /home/yibo.yl/openjdk/jdk8u/hotspot/src/share/vm/opto/runtime.cpp:245
    

    A possible fix is to use getJavaTraceAsync.

    opened by yanglong1010 1
  • Improve tree view display

    Improve tree view display

    • fix text wrapping for long traces when horizontal scroll is present
    • add vertical line aligned on expland/collapse icon for clearer tree view
    • use ⊕ and ⊖ instead of + and - for better visibility
    • use monospace font for better numerical alignment
    • fix form search on enter key press
    • header form small alignment improvements

    Wrapping

    Before:

    image

    After:

    image

    Form & Alignment

    Before:

    image

    After:

    image
    opened by aleris 0
Releases(v2.9)
Simple JVM Profiler Using StatsD and Other Metrics Backends

statsd-jvm-profiler statsd-jvm-profiler is a JVM agent profiler that sends profiling data to StatsD. Inspired by riemann-jvm-profiler, it was primaril

Etsy, Inc. 330 Oct 30, 2022
Java memory allocation profiler

Aprof - Java Memory Allocation Profiler What is it? The Aprof project is a Java Memory Allocation Profiler with very low performance impact on profile

Devexperts 211 Dec 15, 2022
Java monitoring for the command-line, profiler included

jvmtop is a lightweight console application to monitor all accessible, running jvms on a machine. In a top-like manner, it displays JVM internal metri

null 1.2k Jan 6, 2023
JVM Profiler Sending Metrics to Kafka, Console Output or Custom Reporter

Uber JVM Profiler Uber JVM Profiler provides a Java Agent to collect various metrics and stacktraces for Hadoop/Spark JVM processes in a distributed w

Uber Common 1.7k Dec 22, 2022
production heap profiling for the JVM. compatible with google-perftools.

Heapster Heapster provides an agent library to do heap profiling for JVM processes with output compatible with Google perftools. The goal of Heapster

marius a. eriksen 392 Dec 27, 2022
One file java script for visualizing JDK flight recorder execution logs as flamegraphs without any dependencies except Java and a browser.

Flamegraph from JFR logs Simple one file Java script to generate flamegraphs from Java flight recordings without installing Perl and the Brendan Gregg

Billy Sjöberg 17 Oct 2, 2022
Log analyser / visualiser for Java HotSpot JIT compiler. Inspect inlining decisions, hot methods, bytecode, and assembly. View results in the JavaFX user interface.

JITWatch Log analyser and visualiser for the HotSpot JIT compiler. Video introduction to JITWatch video Slides from my LJC lightning talk on JITWatch

AdoptOpenJDK 2.8k Jan 3, 2023
Kotlin-decompiled - (Almost) every single language construct of the Kotlin programming language compiled to JVM bytecode and then decompiled to Java again for better readability

Kotlin: Decompiled (Almost) every single language construct of the Kotlin programming language compiled to JVM bytecode and then decompiled to Java ag

The Self-Taught Software Engineer 27 Dec 14, 2022
JVM Explorer is a Java desktop application for browsing loaded class files inside locally running Java Virtual Machines.

JVM Explorer JVM Explorer is a Java desktop application for browsing loaded class files inside locally running Java Virtual Machines. Features Browse

null 109 Nov 30, 2022
Small set of tools for JVM troublshooting, monitoring and profiling.

Swiss Java Knife (SJK) SJK is a command line tool for JVM diagnostic, troubleshooting and profiling. SJK exploits standard diagnostic interfaces of JV

Alexey Ragozin 3.2k Jan 3, 2023
Best-of-breed OpenTracing utilities, instrumentations and extensions

OpenTracing Toolbox OpenTracing Toolbox is a collection of libraries that build on top of OpenTracing and provide extensions and plugins to existing i

Zalando SE 181 Oct 15, 2022
A short and practical intro into project loom

project-loom Project loom is all about making concurrency easier (for developers) on the JVM. It is in experimental phase. Download the early access b

Ashwin Bhaskar 16 Dec 15, 2021
Simple Anti-Dump to slow down and annoy attackers.

Anti-Dump A simple Anti-Dump to slow down and annoy attackers. Usage Copy the class into your mod or loader. Rename any instances of dummy/class/path

null 47 Dec 25, 2022
An OpenJDK release maintained and supported by SAP

SapMachine This project contains a downstream version of the OpenJDK project. It is used to build and maintain a SAP supported version of OpenJDK for

SAP 400 Jan 3, 2023
Dynamic loading and compiling project based on JVM

camphor 基于jvm的弹性加载及编译中间件(Elastic loading and compiling middleware based on JVM) camphor_0.0.1 项目简介 该项目定位为弹性中间件,能够使系统在不重启的情况下完成增量代码文件的动态编译和加载 模块介绍 camp

palading 1 Jan 22, 2022
JavaOTTF - Official OTTF parser and composer for JVM languages

JavaOTTF Official OTTF parser and composer for JVM languages. Documentation Please refer to the Wiki Section. Installation Maven Add repository into p

Open Timetable 2 Nov 21, 2022
A sidecar to run alongside Trino to gather metrics using the JMX connector and expose them in different formats using Apache velocity

Overview A sidecar to run alongside Trino to gather metrics using the JMX connector and expose them in different formats using Apache Velocity. Click

BlueCat Engineering 4 Nov 18, 2021
A Java agent that rewrites bytecode to instrument allocation sites

The Allocation Instrumenter is a Java agent written using the java.lang.instrument API and ASM. Each allocation in your Java program is instrumented;

Google 438 Dec 19, 2022
BTrace - a safe, dynamic tracing tool for the Java platform

btrace A safe, dynamic tracing tool for the Java platform Version 2.1.0 Quick Summary BTrace is a safe, dynamic tracing tool for the Java platform. BT

btrace.io 5.3k Jan 9, 2023