![]()
BPF Compiler Collection (BCC)
BCC is a toolkit for creating efficient kernel tracing and manipulation programs, and includes several useful tools and examples. It makes use of extended BPF (Berkeley Packet Filters), formally known as eBPF, a new feature that was first added to Linux 3.15. Much of what BCC uses requires Linux 4.1 and above.
eBPF was described by Ingo Molnár as:
One of the more interesting features in this cycle is the ability to attach eBPF programs (user-defined, sandboxed bytecode executed by the kernel) to kprobes. This allows user-defined instrumentation on a live kernel image that can never crash, hang or interfere with the kernel negatively.
BCC makes BPF programs easier to write, with kernel instrumentation in C (and includes a C wrapper around LLVM), and front-ends in Python and lua. It is suited for many tasks, including performance analysis and network traffic control.
Screenshot
This example traces a disk I/O kernel function, and populates an in-kernel power-of-2 histogram of the I/O size. For efficiency, only the histogram summary is returned to user-level.
# ./bitehist.py
Tracing... Hit Ctrl-C to end.
^C
     kbytes          : count     distribution
       0 -> 1        : 3        |                                      |
       2 -> 3        : 0        |                                      |
       4 -> 7        : 211      |**********                            |
       8 -> 15       : 0        |                                      |
      16 -> 31       : 0        |                                      |
      32 -> 63       : 0        |                                      |
      64 -> 127      : 1        |                                      |
     128 -> 255      : 800      |**************************************|
The above output shows a bimodal distribution, where the largest mode of 800 I/O was between 128 and 255 Kbytes in size.
See the source: bitehist.py. What this traces, what this stores, and how the data is presented, can be entirely customized. This shows only some of many possible capabilities.
Installing
See INSTALL.md for installation steps on your platform.
FAQ
See FAQ.txt for the most common troubleshoot questions.
Reference guide
See docs/reference_guide.md for the reference guide to the bcc and bcc/BPF APIs.
Contents
Some of these are single files that contain both C and Python, others have a pair of .c and .py files, and some are directories of files.
Tracing
Examples:
- examples/tracing/bitehist.py: Block I/O size histogram. Examples.
- examples/tracing/disksnoop.py: Trace block device I/O latency. Examples.
- examples/hello_world.py: Prints "Hello, World!" for new processes.
- examples/tracing/mysqld_query.py: Trace MySQL server queries using USDT probes. Examples.
- examples/tracing/nodejs_http_server.py: Trace Node.js HTTP server requests using USDT probes. Examples.
- examples/tracing/stacksnoop: Trace a kernel function and print all kernel stack traces. Examples.
- tools/statsnoop: Trace stat() syscalls. Examples.
- examples/tracing/task_switch.py: Count task switches with from and to PIDs.
- examples/tracing/tcpv4connect.py: Trace TCP IPv4 active connections. Examples.
- examples/tracing/trace_fields.py: Simple example of printing fields from traced events.
- examples/tracing/urandomread.py: A kernel tracepoint example, which traces random:urandom_read. Examples.
- examples/tracing/vfsreadlat.py examples/tracing/vfsreadlat.c: VFS read latency distribution. Examples.
- examples/tracing/kvm_hypercall.py: Conditional static kernel tracepoints for KVM entry, exit and hypercall Examples.
Tools:

- tools/argdist: Display function parameter values as a histogram or frequency count. Examples.
- tools/bashreadline: Print entered bash commands system wide. Examples.
- tools/bindsnoop: Trace IPv4 and IPv6 bind() system calls (bind()). Examples.
- tools/biolatency: Summarize block device I/O latency as a histogram. Examples.
- tools/biotop: Top for disks: Summarize block device I/O by process. Examples.
- tools/biosnoop: Trace block device I/O with PID and latency. Examples.
- tools/bitesize: Show per process I/O size histogram. Examples.
- tools/bpflist: Display processes with active BPF programs and maps. Examples.
- tools/btrfsdist: Summarize btrfs operation latency distribution as a histogram. Examples.
- tools/btrfsslower: Trace slow btrfs operations. Examples.
- tools/capable: Trace security capability checks. Examples.
- tools/cachestat: Trace page cache hit/miss ratio. Examples.
- tools/cachetop: Trace page cache hit/miss ratio by processes. Examples.
- tools/compactsnoop: Trace compact zone events with PID and latency. Examples.
- tools/cpudist: Summarize on- and off-CPU time per task as a histogram. Examples
- tools/cpuunclaimed: Sample CPU run queues and calculate unclaimed idle CPU. Examples
- tools/criticalstat: Trace and report long atomic critical sections in the kernel. Examples
- tools/dbslower: Trace MySQL/PostgreSQL queries slower than a threshold. Examples.
- tools/dbstat: Summarize MySQL/PostgreSQL query latency as a histogram. Examples.
- tools/dcsnoop: Trace directory entry cache (dcache) lookups. Examples.
- tools/dcstat: Directory entry cache (dcache) stats. Examples.
- tools/deadlock: Detect potential deadlocks on a running process. Examples.
- tools/dirtop: File reads and writes by directory. Top for directories. Examples.
- tools/drsnoop: Trace direct reclaim events with PID and latency. Examples.
- tools/execsnoop: Trace new processes via exec() syscalls. Examples.
- tools/exitsnoop: Trace process termination (exit and fatal signals). Examples.
- tools/ext4dist: Summarize ext4 operation latency distribution as a histogram. Examples.
- tools/ext4slower: Trace slow ext4 operations. Examples.
- tools/filelife: Trace the lifespan of short-lived files. Examples.
- tools/fileslower: Trace slow synchronous file reads and writes. Examples.
- tools/filetop: File reads and writes by filename and process. Top for files. Examples.
- tools/funccount: Count kernel function calls. Examples.
- tools/funcinterval: Time interval between the same function as a histogram. Examples.
- tools/funclatency: Time functions and show their latency distribution. Examples.
- tools/funcslower: Trace slow kernel or user function calls. Examples.
- tools/gethostlatency: Show latency for getaddrinfo/gethostbyname[2] calls. Examples.
- tools/hardirqs: Measure hard IRQ (hard interrupt) event time. Examples.
- tools/inject: Targeted error injection with call chain and predicates Examples.
- tools/killsnoop: Trace signals issued by the kill() syscall. Examples.
- tools/klockstat: Traces kernel mutex lock events and display locks statistics. Examples.
- tools/llcstat: Summarize CPU cache references and misses by process. Examples.
- tools/mdflush: Trace md flush events. Examples.
- tools/memleak: Display outstanding memory allocations to find memory leaks. Examples.
- tools/mountsnoop: Trace mount and umount syscalls system-wide. Examples.
- tools/mysqld_qslower: Trace MySQL server queries slower than a threshold. Examples.
- tools/netqtop tools/netqtop.c: Trace and display packets distribution on NIC queues. Examples.
- tools/nfsslower: Trace slow NFS operations. Examples.
- tools/nfsdist: Summarize NFS operation latency distribution as a histogram. Examples.
- tools/offcputime: Summarize off-CPU time by kernel stack trace. Examples.
- tools/offwaketime: Summarize blocked time by kernel off-CPU stack and waker stack. Examples.
- tools/oomkill: Trace the out-of-memory (OOM) killer. Examples.
- tools/opensnoop: Trace open() syscalls. Examples.
- tools/pidpersec: Count new processes (via fork). Examples.
- tools/profile: Profile CPU usage by sampling stack traces at a timed interval. Examples.
- tools/readahead: Show performance of read-ahead cache Examples.
- tools/reset-trace: Reset the state of tracing. Maintenance tool only. Examples.
- tools/runqlat: Run queue (scheduler) latency as a histogram. Examples.
- tools/runqlen: Run queue length as a histogram. Examples.
- tools/runqslower: Trace long process scheduling delays. Examples.
- tools/shmsnoop: Trace System V shared memory syscalls. Examples.
- tools/sofdsnoop: Trace FDs passed through unix sockets. Examples.
- tools/slabratetop: Kernel SLAB/SLUB memory cache allocation rate top. Examples.
- tools/softirqs: Measure soft IRQ (soft interrupt) event time. Examples.
- tools/solisten: Trace TCP socket listen. Examples.
- tools/sslsniff: Sniff OpenSSL written and readed data. Examples.
- tools/stackcount: Count kernel function calls and their stack traces. Examples.
- tools/syncsnoop: Trace sync() syscall. Examples.
- tools/syscount: Summarize syscall counts and latencies. Examples.
- tools/tcpaccept: Trace TCP passive connections (accept()). Examples.
- tools/tcpconnect: Trace TCP active connections (connect()). Examples.
- tools/tcpconnlat: Trace TCP active connection latency (connect()). Examples.
- tools/tcpdrop: Trace kernel-based TCP packet drops with details. Examples.
- tools/tcplife: Trace TCP sessions and summarize lifespan. Examples.
- tools/tcpretrans: Trace TCP retransmits and TLPs. Examples.
- tools/tcprtt: Trace TCP round trip time. Examples.
- tools/tcpstates: Trace TCP session state changes with durations. Examples.
- tools/tcpsubnet: Summarize and aggregate TCP send by subnet. Examples.
- tools/tcpsynbl: Show TCP SYN backlog. Examples.
- tools/tcptop: Summarize TCP send/recv throughput by host. Top for TCP. Examples.
- tools/tcptracer: Trace TCP established connections (connect(), accept(), close()). Examples.
- tools/threadsnoop: List new thread creation. Examples.
- tools/tplist: Display kernel tracepoints or USDT probes and their formats. Examples.
- tools/trace: Trace arbitrary functions, with filters. Examples.
- tools/ttysnoop: Watch live output from a tty or pts device. Examples.
- tools/ucalls: Summarize method calls or Linux syscalls in high-level languages. Examples.
- tools/uflow: Print a method flow graph in high-level languages. Examples.
- tools/ugc: Trace garbage collection events in high-level languages. Examples.
- tools/uobjnew: Summarize object allocation events by object type and number of bytes allocated. Examples.
- tools/ustat: Collect events such as GCs, thread creations, object allocations, exceptions and more in high-level languages. Examples.
- tools/uthreads: Trace thread creation events in Java and raw pthreads. Examples.
- tools/vfscount: Count VFS calls. Examples.
- tools/vfsstat: Count some VFS calls, with column output. Examples.
- tools/virtiostat: Show VIRTIO device IO statistics. Examples.
- tools/wakeuptime: Summarize sleep to wakeup time by waker kernel stack. Examples.
- tools/xfsdist: Summarize XFS operation latency distribution as a histogram. Examples.
- tools/xfsslower: Trace slow XFS operations. Examples.
- tools/zfsdist: Summarize ZFS operation latency distribution as a histogram. Examples.
- tools/zfsslower: Trace slow ZFS operations. Examples.
Networking
Examples:
- examples/networking/distributed_bridge/: Distributed bridge example.
- examples/networking/http_filter/: Simple HTTP filter example.
- examples/networking/simple_tc.py: Simple traffic control example.
- examples/networking/simulation.py: Simulation helper.
- examples/networking/neighbor_sharing/tc_neighbor_sharing.py examples/networking/neighbor_sharing/tc_neighbor_sharing.c: Per-IP classification and rate limiting.
- examples/networking/tunnel_monitor/: Efficiently monitor traffic flows.
- examples/networking/vlan_learning/vlan_learning.py examples/vlan_learning.c: Demux Ethernet traffic into worker veth+namespaces.
BPF Introspection:
Tools that help to introspect BPF programs.
Motivation
BPF guarantees that the programs loaded into the kernel cannot crash, and cannot run forever, but yet BPF is general purpose enough to perform many arbitrary types of computation. Currently, it is possible to write a program in C that will compile into a valid BPF program, yet it is vastly easier to write a C program that will compile into invalid BPF (C is like that). The user won't know until trying to run the program whether it was valid or not.
With a BPF-specific frontend, one should be able to write in a language and receive feedback from the compiler on the validity as it pertains to a BPF backend. This toolkit aims to provide a frontend that can only create valid BPF programs while still harnessing its full flexibility.
Furthermore, current integrations with BPF have a kludgy workflow, sometimes involving compiling directly in a linux kernel source tree. This toolchain aims to minimize the time that a developer spends getting BPF compiled, and instead focus on the applications that can be written and the problems that can be solved with BPF.
The features of this toolkit include:
- End-to-end BPF workflow in a shared library
- A modified C language for BPF backends
- Integration with llvm-bpf backend for JIT
- Dynamic (un)loading of JITed programs
- Support for BPF kernel hooks: socket filters, tc classifiers, tc actions, and kprobes
- Bindings for Python
- Examples for socket filters, tc classifiers, and kprobes
- Self-contained tools for tracing a running system
In the future, more bindings besides python will likely be supported. Feel free to add support for the language of your choice and send a pull request!
Tutorials
- docs/tutorial.md: Using bcc tools to solve performance, troubleshooting, and networking issues.
- docs/tutorial_bcc_python_developer.md: Developing new bcc programs using the Python interface.
Networking
At Red Hat Summit 2015, BCC was presented as part of a session on BPF. A multi-host vxlan environment is simulated and a BPF program used to monitor one of the physical interfaces. The BPF program keeps statistics on the inner and outer IP addresses traversing the interface, and the userspace component turns those statistics into a graph showing the traffic distribution at multiple granularities. See the code here.

Contributing
Already pumped up to commit some code? Here are some resources to join the discussions in the IOVisor community and see what you want to work on.
- Mailing List: https://lists.iovisor.org/mailman/listinfo/iovisor-dev
- IRC: #iovisor at irc.oftc.net
- BCC Issue Tracker: Github Issues
- A guide for contributing scripts: CONTRIBUTING-SCRIPTS.md
External links
Looking for more information on BCC and how it's being used? You can find links to other BCC content on the web in LINKS.md.


![Use /proc/[pid]/root when looking at /proc/[pid]/maps paths](https://avatars.githubusercontent.com/u/1219664?v=4)


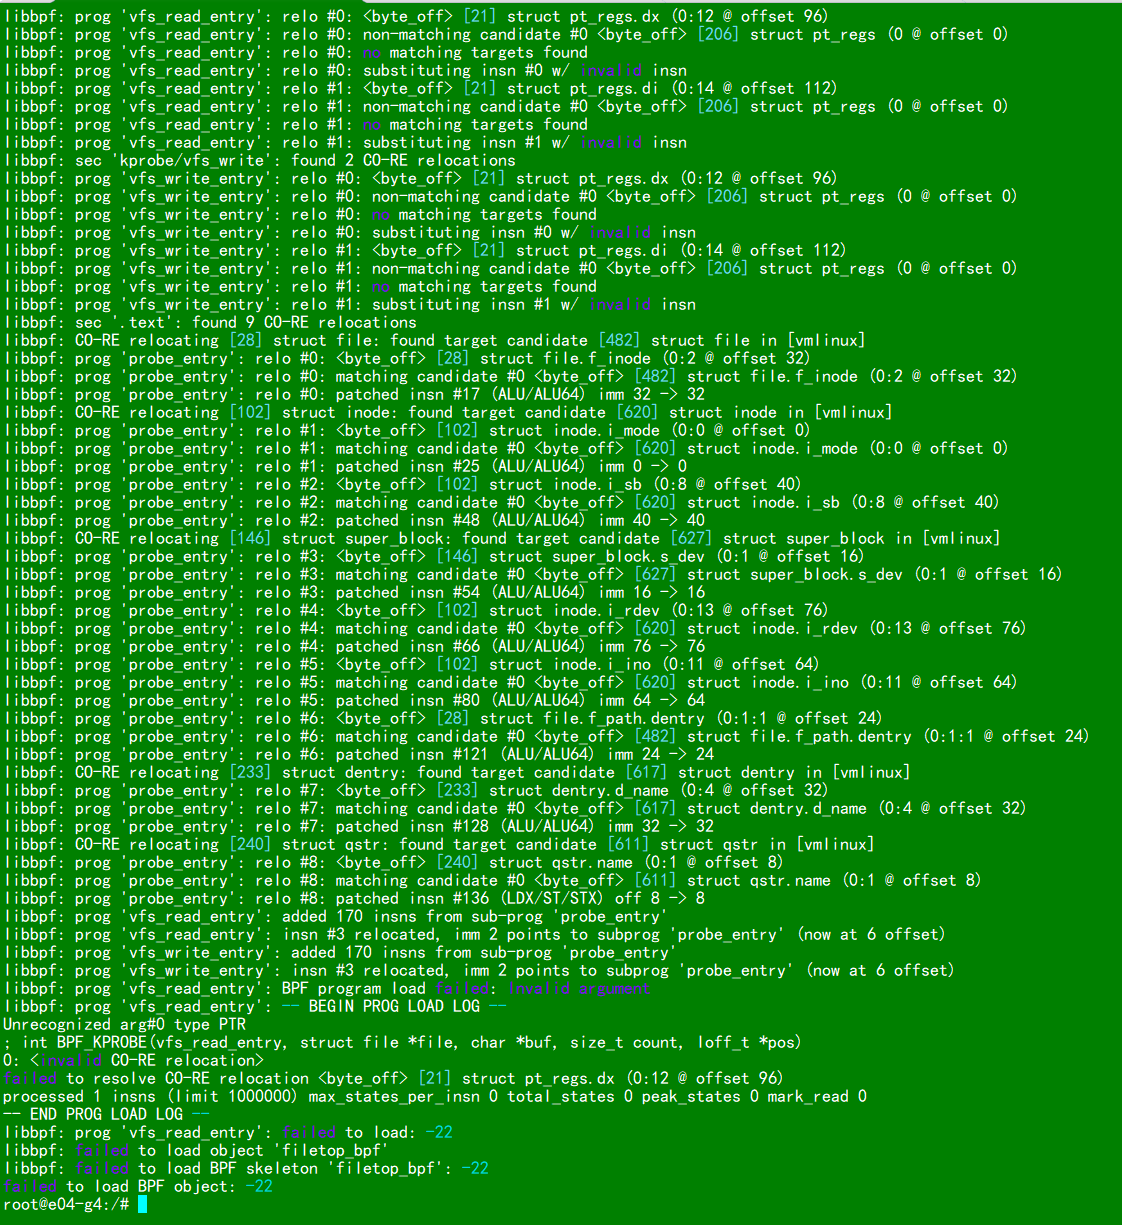
 FILETOP

 TCPSTATUS


 ...
I try to take some measures but not useful,please help me,thanks!
PS1:
my OS info:
Linux e04-g4 5.10.110-yocto-standard #1 SMP PREEMPT Tue Jan 3 09:00:28 UTC 2023 aarch64 GNU/Linux
PS2:
my kernel config:
`CONFIG_TASKS_TRACE_RCU=y
CONFIG_BPF_SYSCALL=y
CONFIG_TRACEPOINTS=y
CONFIG_UPROBES=y
CONFIG_BINARY_PRINTF=y
...
I try to take some measures but not useful,please help me,thanks!
PS1:
my OS info:
Linux e04-g4 5.10.110-yocto-standard #1 SMP PREEMPT Tue Jan 3 09:00:28 UTC 2023 aarch64 GNU/Linux
PS2:
my kernel config:
`CONFIG_TASKS_TRACE_RCU=y
CONFIG_BPF_SYSCALL=y
CONFIG_TRACEPOINTS=y
CONFIG_UPROBES=y
CONFIG_BINARY_PRINTF=y


 1.3k Dec 28, 2022
 8.8k Dec 28, 2022
 2 Feb 1, 2022
 26 Nov 16, 2022
 2 Apr 9, 2022
 87 Oct 17, 2022
 3 Oct 19, 2022
 561 Nov 27, 2022
 3.2k Jan 3, 2023
 6 Feb 3, 2022
 3.7k Dec 30, 2022
 2 Dec 19, 2022
 12.4k Jan 3, 2023
 4 Jan 14, 2022
 12.6k Jan 3, 2023
 1 May 12, 2022
 206 Oct 5, 2022
 805 Dec 30, 2022
 28 Nov 25, 2022
 6 Dec 22, 2022