34 Repositories
Java metrics Libraries
Check performance metrics by running Selenium 4 tests with JUnit on LambdaTest cloud.

Run Selenium 4 Tests With JUnit On LambdaTest Blog ⋅ Docs ⋅ Learning Hub ⋅ Newsletter ⋅ Certifications ⋅ YouTube Learn how to use JUnit framewor
Highly customized business metrics monitoring with TDengine & Spring Boot

Horus —— Highly customized business metrics monitoring with TDengine & Spring Boot 给予业务指标监控的高度定制自由 设计文档:https://akhnhwmr9k.feishu.cn/wiki/wikcnJJFmDHj
A sidecar to run alongside Trino to gather metrics using the JMX connector and expose them in different formats using Apache velocity
Overview A sidecar to run alongside Trino to gather metrics using the JMX connector and expose them in different formats using Apache Velocity. Click
Cloud native multi-runtime microservice framework

Femas: Cloud native multi-runtime microservice framework Show me femas username:admin password:123456 If you like,star fork it and join us English | 简
Tool for providing an HTTP endpoint to retrieve predefined aggregations on metrics of an InfluxDB.
InfluxDB DWH Exporter This application provides an HTTP endpoint that can deliver metrics from an InfluxDB in an aggregated form when called. This can
The Prometheus monitoring system and time series database.
Prometheus Visit prometheus.io for the full documentation, examples and guides. Prometheus, a Cloud Native Computing Foundation project, is a systems
Distributed Tracing, Metrics and Context Propagation for application running on the JVM
Kamon Kamon is a set of tools for instrumenting applications running on the JVM. The best way to get started is to go to our official Get Started Page
inspectIT is the leading Open Source APM (Application Performance Management) tool for analyzing your Java (EE) applications.

🔥 inspectIT OpenCensus Edition has been released 🔥 The inspectIT OCE project provides an improved Java agent newly developed from scratch focusing o
Unconventional Java code for building web servers / services without a framework.
Unconventional Java code for building web servers / services without a framework. Think dropwizard but as a seed project instead of a framework. If this project had a theme it would be break the rules but be mindful of your decisions.
APM, Application Performance Monitoring System
Apache SkyWalking SkyWalking: an APM(application performance monitor) system, especially designed for microservices, cloud native and container-based
Code metrics for Java code by means of static analysis
CK CK calculates class-level and method-level code metrics in Java projects by means of static analysis (i.e. no need for compiled code). Currently, i
The Most Advanced Time Series Platform
Warp 10 Platform Introduction Warp 10 is an Open Source Geo Time Series Platform designed to handle data coming from sensors, monitoring systems and t
An open source SQL database designed to process time series data, faster
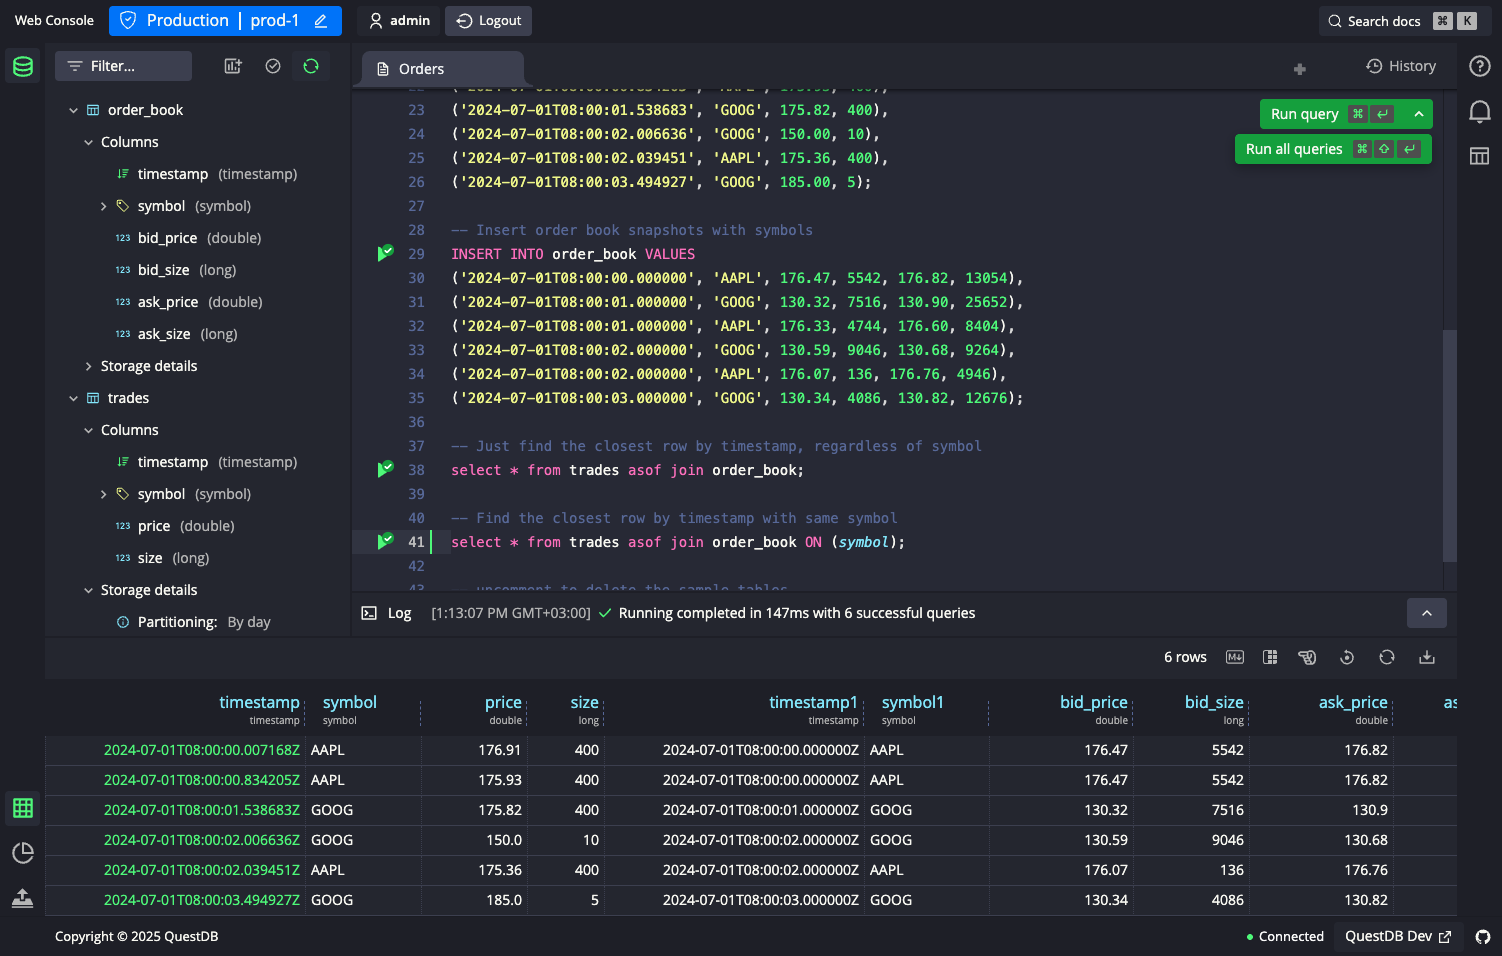
English | 简体中文 | العربية QuestDB QuestDB is a high-performance, open-source SQL database for applications in financial services, IoT, machine learning
Fast scalable time series database
KairosDB is a fast distributed scalable time series database written on top of Cassandra. Documentation Documentation is found here. Frequently Asked
Time Series Metrics Engine based on Cassandra
Hawkular Metrics, a storage engine for metric data About Hawkular Metrics is the metric data storage engine part of Hawkular community. It relies on A
Time series monitoring and alerting platform.

Argus Argus is a time-series monitoring and alerting platform. It consists of discrete services to configure alerts, ingest and transform metrics & ev
The Java agent for Apache SkyWalking
Apache SkyWalking Java Agent SkyWalking-Java: The Java Agent for Apache SkyWalking, which provides the native tracing/metrics/logging abilities for Ja
面向开发人员、声明式的 Metrics 采集与监控系统,可以对结构化与非结构化、有界数据与无界数据进行采集,通过对采集数据进行提取、过滤、逻辑运算等处理后将结果存储流行的监控系统或存储引擎中(如 Prometheus、Nightingale、Open-Falcon)从而搭建起完整的监控体系,同时也可以结合 grafana 完成数据的可视化
.png)
介绍 AnyMetrics - 面向开发人员、声明式的 Metrics 采集与监控系统,可以对结构化与非结构化、有界数据与无界数据进行采集,通过对采集数据进行提取、过滤、逻辑运算、聚合等处理后将结果存储流行的监控系统或存储引擎中(如 Prometheus、Nightingale、Open-Falco
Publish Jenkins performances metrics to an OpenTelemetry endpoint, including distributed traces of job executions and health metrics of the controller.
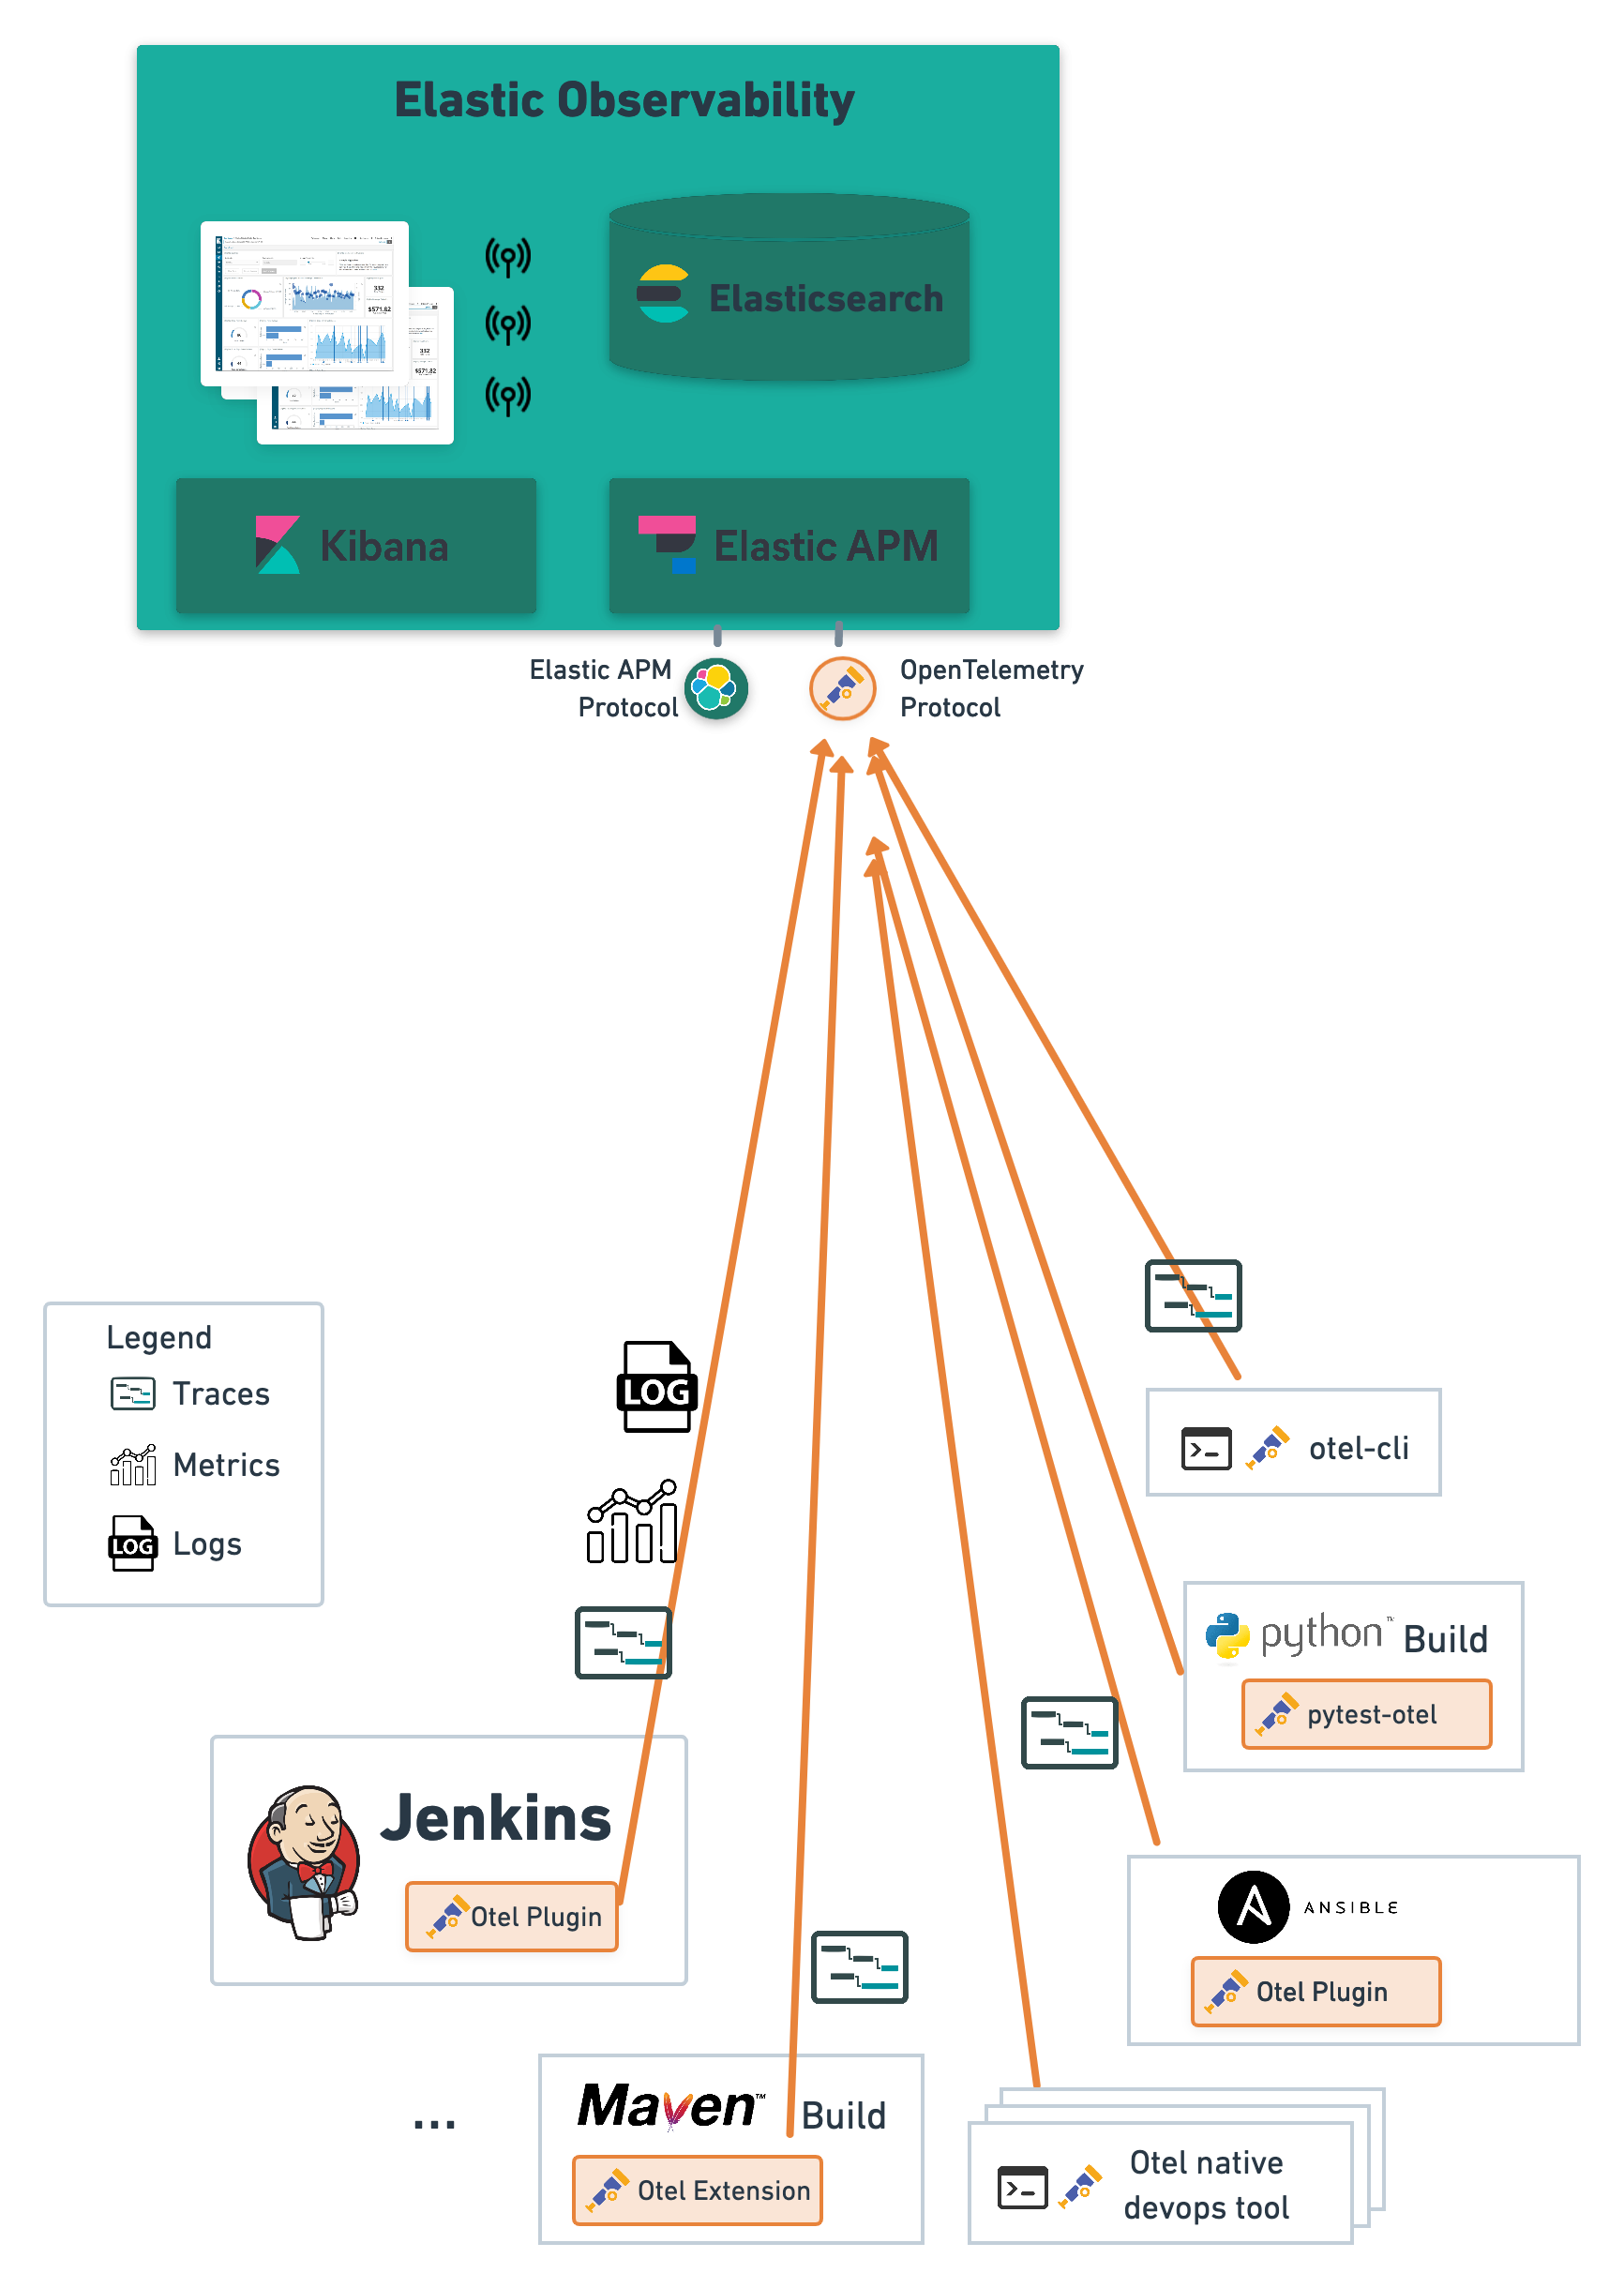
OpenTelemetry Introduction Architecture Features Getting Started Examples Configuration as Code Contributing Introduction Collect Jenkins monitoring d
CodeSheriff is a simple library that helps you in writing JUnit tests that check the quality of your code
CodeSheriff is a simple library that helps you in writing JUnit tests that check the quality of your code. For example, CodeSheriff may fail because you have methods in your code that have more than X lines of code, or that have complexity greater than Y.
:chart_with_upwards_trend: Capturing JVM- and application-level metrics. So you know what's going on.
Metrics 📈 Capturing JVM- and application-level metrics. So you know what's going on. For more information, please see the documentation Versions Vers
Simple JVM Profiler Using StatsD and Other Metrics Backends
statsd-jvm-profiler statsd-jvm-profiler is a JVM agent profiler that sends profiling data to StatsD. Inspired by riemann-jvm-profiler, it was primaril
An application metrics facade for the most popular monitoring tools. Think SLF4J, but for metrics.
Micrometer Application Metrics An application metrics facade for the most popular monitoring tools. Instrument your code with dimensional metrics with
JVM Profiler Sending Metrics to Kafka, Console Output or Custom Reporter
Uber JVM Profiler Uber JVM Profiler provides a Java Agent to collect various metrics and stacktraces for Hadoop/Spark JVM processes in a distributed w
Minimalist Java framework for rapidly creating scalable, containerless, RESTful microservices. Ship a production-quality, headless, RESTful API in the shortest time possible. Uses Netty for HTTP, Jackson for JSON, Metrics for metrics, properties files for configuration. Sub-projects and plugins enable, NoSQL, Swagger, Auth0, HAL integration, etc.
RestExpress is a thin wrapper on the JBOSS Netty HTTP stack to provide a simple and easy way to create RESTful services in Java that support massive I
an open source solution to application performance monitoring for java server applications

Stagemonitor is a Java monitoring agent that tightly integrates with time series databases like Elasticsearch, Graphite and InfluxDB to analyze graphe
Sematext Monitoring Agent
Sematext App Agent This repository contains the source code for Sematext App Agent. Sematext App Agent can be used to collect application metrics from
Prometheus instrumentation library for JVM applications
Prometheus JVM Client It supports Java, Clojure, Scala, JRuby, and anything else that runs on the JVM. Table of Contents Using Assets Javadocs Instrum
:chart_with_upwards_trend: Capturing JVM- and application-level metrics. So you know what's going on.
Metrics 📈 Capturing JVM- and application-level metrics. So you know what's going on. For more information, please see the documentation Versions Vers
JavaMelody : monitoring of JavaEE applications
JavaMelody The goal of JavaMelody is to monitor Java or Java EE applications in QA and production environments. See the Project Home, Screenshots, Use
Your window into the Elastic Stack
Kibana Kibana is your window into the Elastic Stack. Specifically, it's a browser-based analytics and search dashboard for Elasticsearch. Getting Star
Resilience4j is a fault tolerance library designed for Java8 and functional programming
Fault tolerance library designed for functional programming Table of Contents 1. Introduction 2. Documentation 3. Overview 4. Resilience patterns 5. S
Vibur DBCP - concurrent and dynamic JDBC connection pool
Vibur DBCP is concurrent, fast, and fully-featured JDBC connection pool, which provides advanced performance monitoring capabilities, including slow S
FlexyPool adds metrics and failover strategies to a given Connection Pool, allowing it to resize on demand.

Introduction The FlexyPool library adds metrics and flexible strategies to a given Connection Pool, allowing it to resize on demand. This is very hand