A High Dynamic Range (HDR) Histogram

Overview

HdrHistogram

Gitter Build Status Java CI Javadocs Total alerts Language grade: Java


HdrHistogram: A High Dynamic Range (HDR) Histogram

This repository currently includes a Java implementation of HdrHistogram. C, C#/.NET, Python, Javascript, Rust, Erlang, and Go ports can be found in other repositories. All of which share common concepts and data representation capabilities. Look at repositories under the HdrHistogram organization for various implementations and useful tools.

Note: The below is an excerpt from a Histogram JavaDoc. While much of it generally applies to other language implementations as well, some details may vary by implementation (e.g. iteration and synchronization), so you should consult the documentation or header information of the specific API library you intend to use.


HdrHistogram supports the recording and analyzing of sampled data value counts across a configurable integer value range with configurable value precision within the range. Value precision is expressed as the number of significant digits in the value recording, and provides control over value quantization behavior across the value range and the subsequent value resolution at any given level.

For example, a Histogram could be configured to track the counts of observed integer values between 0 and 3,600,000,000 while maintaining a value precision of 3 significant digits across that range. Value quantization within the range will thus be no larger than 1/1,000th (or 0.1%) of any value. This example Histogram could be used to track and analyze the counts of observed response times ranging between 1 microsecond and 1 hour in magnitude, while maintaining a value resolution of 1 microsecond up to 1 millisecond, a resolution of 1 millisecond (or better) up to one second, and a resolution of 1 second (or better) up to 1,000 seconds. At its maximum tracked value (1 hour), it would still maintain a resolution of 3.6 seconds (or better).

The HdrHistogram package includes the Histogram implementation, which tracks value counts in long fields, and is expected to be the commonly used Histogram form. IntHistogram and ShortHistogram, which track value counts in int and short fields respectively, are provided for use cases where smaller count ranges are practical and smaller overall storage is beneficial.

HdrHistogram is designed for recording histograms of value measurements in latency and performance sensitive applications. Measurements show value recording times as low as 3-6 nanoseconds on modern (circa 2012) Intel CPUs. AbstractHistogram maintains a fixed cost in both space and time. A Histogram's memory footprint is constant, with no allocation operations involved in recording data values or in iterating through them. The memory footprint is fixed regardless of the number of data value samples recorded, and depends solely on the dynamic range and precision chosen. The amount of work involved in recording a sample is constant, and directly computes storage index locations such that no iteration or searching is ever involved in recording data values.

A combination of high dynamic range and precision is useful for collection and accurate post-recording analysis of sampled value data distribution in various forms. Whether it's calculating or plotting arbitrary percentiles, iterating through and summarizing values in various ways, or deriving mean and standard deviation values, the fact that the recorded data information is kept in high resolution allows for accurate post-recording analysis with low [and ultimately configurable] loss in accuracy when compared to performing the same analysis directly on the potentially infinite series of sourced data values samples.

A common use example of HdrHistogram would be to record response times in units of microseconds across a dynamic range stretching from 1 usec to over an hour, with a good enough resolution to support later performing post-recording analysis on the collected data. Analysis can include computing, examining, and reporting of distribution by percentiles, linear or logarithmic value buckets, mean and standard deviation, or by any other means that can can be easily added by using the various iteration techniques supported by the Histogram. In order to facilitate the accuracy needed for various post-recording analysis techniques, this example can maintain a resolution of ~1 usec or better for times ranging to ~2 msec in magnitude, while at the same time maintaining a resolution of ~1 msec or better for times ranging to ~2 sec, and a resolution of ~1 second or better for values up to 2,000 seconds. This sort of example resolution can be thought of as "always accurate to 3 decimal points." Such an example Histogram would simply be created with a highestTrackableValue of 3,600,000,000, and a numberOfSignificantValueDigits of 3, and would occupy a fixed, unchanging memory footprint of around 185KB (see "Footprint estimation" below).

Histogram variants and internal representation

The HdrHistogram package includes multiple implementations of the AbstractHistogram class:

  • Histogram, which is the commonly used Histogram form and tracks value counts in long fields.
  • IntHistogram and ShortHistogram, which track value counts in int and short fields respectively, are provided for use cases where smaller count ranges are practical and smaller overall storage is beneficial (e.g. systems where tens of thousands of in-memory histogram are being tracked).
  • AtomicHistogram and SynchronizedHistogram (see 'Synchronization and concurrent access' below)

Internally, data in HdrHistogram variants is maintained using a concept somewhat similar to that of floating point number representation: Using an exponent a (non-normalized) mantissa to support a wide dynamic range at a high but varying (by exponent value) resolution. AbstractHistogram uses exponentially increasing bucket value ranges (the parallel of the exponent portion of a floating point number) with each bucket containing a fixed number (per bucket) set of linear sub-buckets (the parallel of a non-normalized mantissa portion of a floating point number). Both dynamic range and resolution are configurable, with highestTrackableValue controlling dynamic range, and numberOfSignificantValueDigits controlling resolution.

Synchronization and concurrent access

In the interest of keeping value recording cost to a minimum, the commonly used Histogram class and its IntHistogram and ShortHistogram variants are NOT internally synchronized, and do NOT use atomic variables. Callers wishing to make potentially concurrent, multi-threaded updates or queries against Histogram objects should either take care to externally synchronize and/or order their access, or use the ConcurrentHistogram, AtomicHistogram, or SynchronizedHistogram or variants.

A common pattern seen in histogram value recording involves recording values in a critical path (multi-threaded or not), coupled with a non-critical path reading the recorded data for summary/reporting purposes. When such continuous non-blocking recording operation (concurrent or not) is desired even when sampling, analyzing, or reporting operations are needed, consider using the Recorder and SingleWriterRecorder recorder variants that were specifically designed for that purpose. Recorders provide a recording API similar to Histogram, and internally maintain and coordinate active/inactive histograms such that recording remains wait-free in the presence of accurate and stable interval sampling.

It is worth mentioning that since Histogram objects are additive, it is common practice to use per-thread non-synchronized histograms or SingleWriterRecorders, and using a summary/reporting thread to perform histogram aggregation math across time and/or threads.

Iteration

Histograms supports multiple convenient forms of iterating through the histogram data set, including linear, logarithmic, and percentile iteration mechanisms, as well as means for iterating through each recorded value or each possible value level. The iteration mechanisms are accessible through the HistogramData available through getHistogramData(). Iteration mechanisms all provide HistogramIterationValue data points along the histogram's iterated data set, and are available for the default (corrected) histogram data set via the following HistogramData methods:

  • percentiles: An Iterable<HistogramIterationValue> through the histogram using a PercentileIterator
  • linearBucketValues: An Iterable<HistogramIterationValue> through the histogram using a LinearIterator
  • logarithmicBucketValues: An Iterable<HistogramIterationValue> through the histogram using a LogarithmicIterator
  • recordedValues: An Iterable<HistogramIterationValue> through the histogram using a RecordedValuesIterator
  • allValues: An Iterable<HistogramIterationValue> through the histogram using a AllValuesIterator

Iteration is typically done with a for-each loop statement. E.g.:

 for (HistogramIterationValue v :
      histogram.getHistogramData().percentiles(ticksPerHalfDistance)) {
     ...
 }

or

 for (HistogramIterationValue v :
      histogram.getRawHistogramData().linearBucketValues(unitsPerBucket)) {
     ...
 }

The iterators associated with each iteration method are resettable, such that a caller that would like to avoid allocating a new iterator object for each iteration loop can re-use an iterator to repeatedly iterate through the histogram. This iterator re-use usually takes the form of a traditional for loop using the Iterator's hasNext() and next() methods.

So to avoid allocating a new iterator object for each iteration loop:

 PercentileIterator iter =
    histogram.getHistogramData().percentiles().iterator(ticksPerHalfDistance);
 ...
 iter.reset(percentileTicksPerHalfDistance);
 for (iter.hasNext() {
     HistogramIterationValue v = iter.next();
     ...
 }

Equivalent Values and value ranges

Due to the finite (and configurable) resolution of the histogram, multiple adjacent integer data values can be "equivalent". Two values are considered "equivalent" if samples recorded for both are always counted in a common total count due to the histogram's resolution level. HdrHistogram provides methods for determining the lowest and highest equivalent values for any given value, as well as determining whether two values are equivalent, and for finding the next non-equivalent value for a given value (useful when looping through values, in order to avoid a double-counting count).

Corrected vs. Raw value recording calls

In order to support a common use case needed when histogram values are used to track response time distribution, Histogram provides for the recording of corrected histogram value by supporting a recordValueWithExpectedInterval() variant is provided. This value recording form is useful in [common latency measurement] scenarios where response times may exceed the expected interval between issuing requests, leading to "dropped" response time measurements that would typically correlate with "bad" results.

When a value recorded in the histogram exceeds the expectedIntervalBetweenValueSamples parameter, recorded histogram data will reflect an appropriate number of additional values, linearly decreasing in steps of expectedIntervalBetweenValueSamples, down to the last value that would still be higher than expectedIntervalBetweenValueSamples.

To illustrate why this corrective behavior is critically needed in order to accurately represent value distribution when large value measurements may lead to missed samples, imagine a system for which response times samples are taken once every 10 msec to characterize response time distribution. The hypothetical system behaves "perfectly" for 100 seconds (10,000 recorded samples), with each sample showing a 1msec response time value. At each sample for 100 seconds (10,000 logged samples at 1 msec each). The hypothetical system then encounters a 100 sec pause during which only a single sample is recorded (with a 100 second value). The raw data histogram collected for such a hypothetical system (over the 200 second scenario above) would show ~99.99% of results at 1 msec or below, which is obviously "not right". The same histogram, corrected with the knowledge of an expectedIntervalBetweenValueSamples of 10msec will correctly represent the response time distribution. Only ~50% of results will be at 1 msec or below, with the remaining 50% coming from the auto-generated value records covering the missing increments spread between 10msec and 100 sec.

Data sets recorded with and without an expectedIntervalBetweenValueSamples parameter will differ only if at least one value recorded with the recordValue method was greater than its associated expectedIntervalBetweenValueSamples parameter. Data sets recorded with an expectedIntervalBetweenValueSamples parameter will be identical to ones recorded without it if all values recorded via the recordValue calls were smaller than their associated (and optional) expectedIntervalBetweenValueSamples parameters.

When used for response time characterization, the recording with the optional expectedIntervalBetweenValueSamples parameter will tend to produce data sets that would much more accurately reflect the response time distribution that a random, uncoordinated request would have experienced.

Footprint estimation

Due to its dynamic range representation, Histogram is relatively efficient in memory space requirements given the accuracy and dynamic range it covers. Still, it is useful to be able to estimate the memory footprint involved for a given highestTrackableValue and numberOfSignificantValueDigits combination. Beyond a relatively small fixed-size footprint used for internal fields and stats (which can be estimated as "fixed at well less than 1KB"), the bulk of a Histogram's storage is taken up by its data value recording counts array. The total footprint can be conservatively estimated by:

 largestValueWithSingleUnitResolution =
        2 * (10 ^ numberOfSignificantValueDigits);
 subBucketSize =
        roundedUpToNearestPowerOf2(largestValueWithSingleUnitResolution);

 expectedHistogramFootprintInBytes = 512 +
      ({primitive type size} / 2) *
      (log2RoundedUp((highestTrackableValue) / subBucketSize) + 2) *
      subBucketSize

A conservative (high) estimate of a Histogram's footprint in bytes is available via the getEstimatedFootprintInBytes() method.

Comments
  • Recorder for ints and shorts

    Recorder for ints and shorts

    Recorder only works with Histogram (long counts). I would find it useful to be able to construct a Recorder that could be backed by Histrogram, IntCountsHistogram or ShortCountsHistogram. Then the component that records values can just use the Recorder without knowledge of the specific type of histogram that is backing it.

    I could take a stab at this with some design advice.

    opened by luciferous 18
  • ArrayIndexOutOfBoundsException on ConcurrentDoubleHistogram#recordValue

    ArrayIndexOutOfBoundsException on ConcurrentDoubleHistogram#recordValue

    I'm working on implementing a HdrHistogram based Summary metric collector for Prometheus, as the default CKMS based Summary metric collector is not performant enough for our use cases. https://github.com/prometheus/client_java/pull/484

    We experienced ArrayIndexOutOfBoundsException on ConcurrentDoubleHistogram#recordValue during load testing under realistic workload(s) with high-throughput and high-concurrency (200mn+ calls / day, 100+ threads). I couldn't yet reproduce the same exception under controlled conditions (-ea, unit tests, JMH benchmarks, serial tests, concurrent tests, static data, randomized data, ...). I could only trigger similar exceptions when a measurement is outside of the widest possible dynamic range, but that's a different scenario which is expected for invalid measurements. https://github.com/HdrHistogram/HdrHistogram/blob/master/src/main/java/org/HdrHistogram/DoubleHistogram.java#L557 https://github.com/HdrHistogram/HdrHistogram/blob/master/src/main/java/org/HdrHistogram/DoubleHistogram.java#L416

    It looks like it’s a rare concurrency bug happening when recording values while auto-resizing or value shifting, but I'm still investigating and exploring HdrHistogram code to understand the details.

    1st occurrence - immediately after restart, no error handling:

    java.lang.ArrayIndexOutOfBoundsException: Index 67584 out of bounds for length 65536
      at java.base/java.lang.invoke.VarHandle$1.apply(VarHandle.java:2011)
      at java.base/java.lang.invoke.VarHandle$1.apply(VarHandle.java:2008)
      at java.base/jdk.internal.util.Preconditions$1.apply(Preconditions.java:159)
      at java.base/jdk.internal.util.Preconditions$1.apply(Preconditions.java:156)
      at java.base/jdk.internal.util.Preconditions.outOfBounds(Preconditions.java:62)
      at java.base/jdk.internal.util.Preconditions.outOfBoundsCheckIndex(Preconditions.java:70)
      at java.base/jdk.internal.util.Preconditions.checkIndex(Preconditions.java:248)
      at java.base/java.lang.invoke.VarHandleLongs$Array.getAndAdd(VarHandleLongs.java:721)
      at java.base/java.lang.invoke.VarHandleGuards.guard_LIJ_J(VarHandleGuards.java:778)
      at java.base/java.util.concurrent.atomic.AtomicLongArray.incrementAndGet(AtomicLongArray.java:234)
      at org.HdrHistogram.ConcurrentHistogram.recordConvertedDoubleValue(ConcurrentHistogram.java:169)
      at org.HdrHistogram.DoubleHistogram.recordSingleValue(DoubleHistogram.java:353)
      at org.HdrHistogram.DoubleHistogram.recordValue(DoubleHistogram.java:294)
      at io.prometheus.client.TimeWindowQuantiles.insert(TimeWindowQuantiles.java:53)
      at io.prometheus.client.Summary$Child.observe(Summary.java:264)
      ...
    

    2nd occurrence - during normal operation, improved error handling:

    java.lang.RuntimeException: Failed to record 0.019 in bucket org.HdrHistogram.ConcurrentDoubleHistogram@47729061
    encodeIntoCompressedByteBuffer: DHISTwAAAAMAAAAAAAAABByEkxQAAABBeNqTaZkszMDAoMwAAcxQmhFC2f+3OwBhHZdgecrONJWDpZuF5zozSzMTUz8bVzcL03VmjkZGlnqWRkY2AGoTC78=
      at io.prometheus.client.TimeWindowQuantiles.insert(TimeWindowQuantiles.java:65)
      at io.prometheus.client.Summary$Child.observe(Summary.java:264)
      ...
    Caused by: java.lang.ArrayIndexOutOfBoundsException: Index 4317 out of bounds for length 4096
      at java.base/java.lang.invoke.VarHandle$1.apply(VarHandle.java:2011)
      at java.base/java.lang.invoke.VarHandle$1.apply(VarHandle.java:2008)
      at java.base/jdk.internal.util.Preconditions$1.apply(Preconditions.java:159)
      at java.base/jdk.internal.util.Preconditions$1.apply(Preconditions.java:156)
      at java.base/jdk.internal.util.Preconditions.outOfBounds(Preconditions.java:62)
      at java.base/jdk.internal.util.Preconditions.outOfBoundsCheckIndex(Preconditions.java:70)
      at java.base/jdk.internal.util.Preconditions.checkIndex(Preconditions.java:248)
      at java.base/java.lang.invoke.VarHandleLongs$Array.getAndAdd(VarHandleLongs.java:721)
      at java.base/java.lang.invoke.VarHandleGuards.guard_LIJ_J(VarHandleGuards.java:778)
      at java.base/java.util.concurrent.atomic.AtomicLongArray.incrementAndGet(AtomicLongArray.java:234)
      at org.HdrHistogram.ConcurrentHistogram.recordConvertedDoubleValue(ConcurrentHistogram.java:169)
      at org.HdrHistogram.DoubleHistogram.recordSingleValue(DoubleHistogram.java:353)
      at org.HdrHistogram.DoubleHistogram.recordValue(DoubleHistogram.java:294)
      at io.prometheus.client.TimeWindowQuantiles.insert(TimeWindowQuantiles.java:57)
      ...
    

    3rd occurrence - during normal operation, improved error handling:

    java.lang.RuntimeException: Failed to record 0.012 in bucket org.HdrHistogram.ConcurrentDoubleHistogram@ed824791
    encodeIntoCompressedByteBuffer: DHISTwAAAAMAAAAAAAAAAhyEkxQAAAAieNqTaZkszMDAwMIAAcxQmhFCyf+32wBhMa0VYAIAUp8EHA==
      at io.prometheus.client.TimeWindowQuantiles.insert(TimeWindowQuantiles.java:65)
      at io.prometheus.client.Summary$Child.observe(Summary.java:264)
      ...
    Caused by: java.lang.ArrayIndexOutOfBoundsException: Index 4644 out of bounds for length 4096
      at java.base/java.lang.invoke.VarHandle$1.apply(VarHandle.java:2011)
      at java.base/java.lang.invoke.VarHandle$1.apply(VarHandle.java:2008)
      at java.base/jdk.internal.util.Preconditions$1.apply(Preconditions.java:159)
      at java.base/jdk.internal.util.Preconditions$1.apply(Preconditions.java:156)
      at java.base/jdk.internal.util.Preconditions.outOfBounds(Preconditions.java:62)
      at java.base/jdk.internal.util.Preconditions.outOfBoundsCheckIndex(Preconditions.java:70)
      at java.base/jdk.internal.util.Preconditions.checkIndex(Preconditions.java:248)
      at java.base/java.lang.invoke.VarHandleLongs$Array.getAndAdd(VarHandleLongs.java:721)
      at java.base/java.lang.invoke.VarHandleGuards.guard_LIJ_J(VarHandleGuards.java:778)
      at java.base/java.util.concurrent.atomic.AtomicLongArray.incrementAndGet(AtomicLongArray.java:234)
      at org.HdrHistogram.ConcurrentHistogram.recordConvertedDoubleValue(ConcurrentHistogram.java:169)
      at org.HdrHistogram.DoubleHistogram.recordSingleValue(DoubleHistogram.java:353)
      at org.HdrHistogram.DoubleHistogram.recordValue(DoubleHistogram.java:294)
      at io.prometheus.client.TimeWindowQuantiles.insert(TimeWindowQuantiles.java:57)
      ...
    

    I improved error handling by serializing the histogram and logging the offending value:

        try {
            bucket.recordValue(value);
        } catch (ArrayIndexOutOfBoundsException e) {
            ByteBuffer byteBuffer = ByteBuffer.allocate(bucket.getNeededByteBufferCapacity());
            bucket.encodeIntoCompressedByteBuffer(byteBuffer, Deflater.BEST_COMPRESSION);
            byteBuffer.flip();
            byte[] byteArray = new byte[byteBuffer.limit()];
            byteBuffer.get(byteArray);
            String base64 = Base64.getEncoder().encodeToString(byteArray);
            throw new RuntimeException("Failed to record " + value + " in bucket " + bucket + "\n" + "encodeIntoCompressedByteBuffer: " + base64, e);
        }
    

    I verified that the deserialized histogram is not corrupted and the value could be recorded:

        double value = ...;
        String base64 = ...;
    
        byte[] byteArray = Base64.getDecoder().decode(base64);
        ByteBuffer byteBuffer = ByteBuffer.wrap(byteArray);
        DoubleHistogram bucket = ConcurrentDoubleHistogram.decodeFromCompressedByteBuffer(byteBuffer, ConcurrentHistogram.class, 2);
        bucket.setAutoResize(true);
    
        bucket.recordValue(value);
    

    It looks like increasing the initial dynamic range avoids the issue as it reduces auto-resizing or value shifting, but it might still fail on larger measurements which trigger auto-resizing or value shifting. https://github.com/prometheus/client_java/pull/484#discussion_r299942012

    We could swallow the exception and drop the measurement, so this is not a showstopper for our use cases, but I'm not sure if it's acceptable for others, especially use cases other than application metrics.

    opened by ghost 15
  • add method double getMeanBelowPercentile(final double percentile)

    add method double getMeanBelowPercentile(final double percentile)

    Hi guys,

    Most time I do not like the whole mean time, I just wanted the mean time below 99.9%. Could you please consider add a method to get the mean time by percentile.

    Thanks a lot! Jiming

    opened by jiming 13
  • Rust port

    Rust port

    @giltene: As you saw on Twitter, I've written a Rust port of HdrHistogram. It is about on feature parity with the Python port at the moment as far as I can tell. I'm also planning on porting more features as I get the time (which ones do you think I should prioritize?). Would you consider adding it to the official list of ports?

    On a separate note, I've licensed the code under MIT/Apache 2.0, which is the de facto Rust license. Hope that's okay? I also refer back to HdrHistogram where appropriate, but am happy add more attribution if you feel like it's a bit on the light side at the moment :)

    opened by jonhoo 12
  • Improve memory efficiency

    Improve memory efficiency

    Ideally, to ensure a given maximum relative error r the bucket boundaries must not differ by more than a factor of (1+r). If we want to cover a range [a,b], we need at least (log(b)-log(a))/log(1+r) bins.

    The allocated array sizes of HDR histogram are often much larger than this theoretical limit. For example, ((Histogram)(new DoubleHistogram(130, 4).integerValuesHistogram)).counts.length gives 163840 while the theoretically needed number of buckets is log(130)/log(1.0001) or approximately 48678 which is more than a factor 3 less.

    Of course, using the optimal number of buckets, each with equal width on the logarithmic scale is not feasible, because the index function which maps a given value to the corresponding bucket would require costly evaluations of the logarithm. The key idea of the HDR histogram approach is to use slightly smaller buckets in such a way that the corresponding index function is less expensive. By nature, this optimization is at the expense of memory utilization. There are multiple effects which increase the memory costs of the HDR histogram approach:

    • As far as I understand the HDR approach is only able to limit the relative error to values that are a power of 1/2. That means if a maximum relative error of 0.01 needs to be guaranteed, the HDR approch must limit the relative error to (1/2)^7 = 0.0078, because (1/2)^6 = 0.0156 is too large.
    • Sequences of buckets of equal width (on the linear scale) range from some value to the double of that value. To cover the same range with buckets of equal width on the logarithmic scale approximately 30% less buckets would be required.
    • I did not analyze the code in detail. However, I guess there are some other issues that further increase the memory costs, e.g. memory alignment, array resizing, auto-scaling?

    Since I really liked the HDR key idea to use smaller bucket sizes to reduce indexing costs, I tried to find another index function that is more optimal regarding memory, but still cheap to evaluate. Here is what I have got so far. The bucket sizes are only slightly reduced which means that not more than approx. 8% additional buckets (compared to the optimal number) are required to cover the given range while keeping the relative error below the specified maximum. First tests gave me an average recording time of about 6ns per value. Maybe the proposed approach can tackle both memory and CPU costs.

    opened by oertl 12
  • Load generator CO free and HdrHistogram

    Load generator CO free and HdrHistogram

    HI Gil,

    sorry to ask this another time, but I'm not able to fully understand the relation of HdrHistogram CO compensation and a proper (hopefully) CO free load generator. If I'm already using a load generator that would trigger requests according to a defined schedule (ie that won't "coordinate" with the measured system, trying to stick to a fixed rate, but speeding it up to keepup if necessary) and I'm already using HdrHistogram::recordValue using the response time ie (endOfOperation - intendedStart):

    1. am I using HdrHistogram in the right way?
    2. am I correctly measuring responsiveness under load with it?

    Thanks for every explanation you give :)

    NOTE: I will put this issue/question link on mechanical sympathy to get anyone interested in, able to comment or just read it :)

    opened by franz1981 11
  • Update .NET to VS2015 format

    Update .NET to VS2015 format

    Just a small update to bring the .NET code to the new VisualStudio 2015 format. This allows devs to use the (free) VS2015 Community SKU to code against it.

    opened by LeeCampbell 9
  • Completion of error handling

    Completion of error handling

    I have looked at a few source files for your current software. I have noticed that some checks for return codes are missing.

    Would you like to add more error handling for return values from functions like the following?

    opened by elfring 9
  • Concurrent write resize issue

    Concurrent write resize issue

    Continued from https://gist.github.com/marshallpierce/9e22df2be9c9f42ab875 and https://twitter.com/giltene/status/547905010470641664.

    With HdrHistogram @ 3f34467, it's now much less frequent. Most of the jmh runs complete.

    With the (default) config:

    # VM invoker: /Library/Java/JavaVirtualMachines/jdk1.8.0_25.jdk/Contents/Home/jre/bin/java
    # VM options: -Dfile.encoding=UTF-8 -Duser.country=US -Duser.language=en -Duser.variant
    # Warmup: 20 iterations, 1 s each
    # Measurement: 20 iterations, 1 s each
    # Timeout: 10 min per iteration
    # Threads: 3 threads, will synchronize iterations
    # Benchmark mode: Throughput, ops/time
    # Benchmark: org.mpierce.metrics.reservoir.hdrhistogram.HdrHistogramReservoirJmh.readWhileRecording
    

    I'm seeing only two failures instead of all but two runs failing.

    # Run progress: 40.00% complete, ETA 00:04:52
    # Fork: 5 of 10
    # Warmup Iteration   1: <failure>
    
    java.lang.IndexOutOfBoundsException: index 2688
        at java.util.concurrent.atomic.AtomicLongArray.checkedByteOffset(AtomicLongArray.java:65)
        at java.util.concurrent.atomic.AtomicLongArray.lazySet(AtomicLongArray.java:137)
        at org.HdrHistogram.ConcurrentHistogram.resize(ConcurrentHistogram.java:265)
        at org.HdrHistogram.AbstractHistogram.handleRecordException(AbstractHistogram.java:428)
        at org.HdrHistogram.AbstractHistogram.recordSingleValue(AbstractHistogram.java:418)
        at org.HdrHistogram.AbstractHistogram.recordValue(AbstractHistogram.java:331)
        at org.HdrHistogram.Recorder.recordValue(Recorder.java:98)
        at org.mpierce.metrics.reservoir.hdrhistogram.HdrHistogramReservoir.update(HdrHistogramReservoir.java:58)
        at org.mpierce.metrics.reservoir.hdrhistogram.HdrHistogramReservoirJmh.recordMeasurements(HdrHistogramReservoirJmh.java:28)
        at org.mpierce.metrics.reservoir.hdrhistogram.generated.HdrHistogramReservoirJmh_readWhileRecording.recordMeasurements_thrpt_jmhStub(HdrHistogramReservoirJmh_readWhileRecording.java:167)
        at org.mpierce.metrics.reservoir.hdrhistogram.generated.HdrHistogramReservoirJmh_readWhileRecording.readWhileRecording_Throughput(HdrHistogramReservoirJmh_readWhileRecording.java:118)
        at sun.reflect.NativeMethodAccessorImpl.invoke0(Native Method)
        at sun.reflect.NativeMethodAccessorImpl.invoke(NativeMethodAccessorImpl.java:62)
        at sun.reflect.DelegatingMethodAccessorImpl.invoke(DelegatingMethodAccessorImpl.java:43)
        at java.lang.reflect.Method.invoke(Method.java:483)
        at org.openjdk.jmh.runner.LoopBenchmarkHandler$BenchmarkTask.call(LoopBenchmarkHandler.java:198)
        at org.openjdk.jmh.runner.LoopBenchmarkHandler$BenchmarkTask.call(LoopBenchmarkHandler.java:180)
        at java.util.concurrent.FutureTask.run(FutureTask.java:266)
        at java.util.concurrent.ThreadPoolExecutor.runWorker(ThreadPoolExecutor.java:1142)
        at java.util.concurrent.ThreadPoolExecutor$Worker.run(ThreadPoolExecutor.java:617)
        at java.lang.Thread.run(Thread.java:745)
    

    and

    # Run progress: 80.00% complete, ETA 00:01:25
    # Fork: 9 of 10
    # Warmup Iteration   1: <failure>
    
    java.lang.IndexOutOfBoundsException: index 2816
        at java.util.concurrent.atomic.AtomicLongArray.checkedByteOffset(AtomicLongArray.java:65)
        at java.util.concurrent.atomic.AtomicLongArray.lazySet(AtomicLongArray.java:137)
        at org.HdrHistogram.ConcurrentHistogram.resize(ConcurrentHistogram.java:265)
        at org.HdrHistogram.AbstractHistogram.handleRecordException(AbstractHistogram.java:428)
        at org.HdrHistogram.AbstractHistogram.recordSingleValue(AbstractHistogram.java:418)
        at org.HdrHistogram.AbstractHistogram.recordValue(AbstractHistogram.java:331)
        at org.HdrHistogram.Recorder.recordValue(Recorder.java:98)
        at org.mpierce.metrics.reservoir.hdrhistogram.HdrHistogramReservoir.update(HdrHistogramReservoir.java:58)
        at org.mpierce.metrics.reservoir.hdrhistogram.HdrHistogramReservoirJmh.recordMeasurements(HdrHistogramReservoirJmh.java:28)
        at org.mpierce.metrics.reservoir.hdrhistogram.generated.HdrHistogramReservoirJmh_readWhileRecording.recordMeasurements_thrpt_jmhStub(HdrHistogramReservoirJmh_readWhileRecording.java:167)
        at org.mpierce.metrics.reservoir.hdrhistogram.generated.HdrHistogramReservoirJmh_readWhileRecording.readWhileRecording_Throughput(HdrHistogramReservoirJmh_readWhileRecording.java:118)
        at sun.reflect.NativeMethodAccessorImpl.invoke0(Native Method)
        at sun.reflect.NativeMethodAccessorImpl.invoke(NativeMethodAccessorImpl.java:62)
        at sun.reflect.DelegatingMethodAccessorImpl.invoke(DelegatingMethodAccessorImpl.java:43)
        at java.lang.reflect.Method.invoke(Method.java:483)
        at org.openjdk.jmh.runner.LoopBenchmarkHandler$BenchmarkTask.call(LoopBenchmarkHandler.java:198)
        at org.openjdk.jmh.runner.LoopBenchmarkHandler$BenchmarkTask.call(LoopBenchmarkHandler.java:180)
        at java.util.concurrent.FutureTask.run(FutureTask.java:266)
        at java.util.concurrent.ThreadPoolExecutor.runWorker(ThreadPoolExecutor.java:1142)
        at java.util.concurrent.ThreadPoolExecutor$Worker.run(ThreadPoolExecutor.java:617)
        at java.lang.Thread.run(Thread.java:745)
    
    
    opened by marshallpierce 8
  • Histogram getValueAtPercentile throws ArrayIndexOutOfBoundsException

    Histogram getValueAtPercentile throws ArrayIndexOutOfBoundsException

    java.lang.ArrayIndexOutOfBoundsException: 131072
    	at org.HdrHistogram.Histogram.getCountAtIndex(Histogram.java:52) ~[?:?]
    	at org.HdrHistogram.AbstractHistogram.getValueAtPercentile(AbstractHistogram.java:1337) ~[?:?]
    

    That histogram is set up like this:

          histogram = new Histogram(TimeUnit.MINUTES.toMillis(30), 4);
          histogram.setAutoResize(true);
    

    there are an unknown number of calls to reset and update inbetween

          histogram.reset();
    
         histogram.recordValueWithCount(value, samplingMultiplier);
    

    interestingly this exception is logged immediately after

    histogram.getMean();
    

    was invoked successfully.

    it crashed on

    histogram.getValueAtPercentile(50.0d)
    

    I am trying to get a heap dump to inspect this better. Any ideas welcome. Currently I feel that the autoResize could be the problem.

    Version is 2.1.10

    opened by CodingFabian 7
  • ArrayIndexOutOfBoundsException when copying a resizable ConcurrentHistogram

    ArrayIndexOutOfBoundsException when copying a resizable ConcurrentHistogram

    Hi Gil,

    I sometimes have an ArrayIndexOutOfBoundsException when copying a resizable ConcurrentHistogram.

    It looks to me there's a race condition in AbstractHistogram#add: even if the target is resized before copying, it's perfectly possible that the original countsArrayLength is expended during the copy, causing an ArrayIndexOutOfBoundsException.

    opened by slandelle 7
  • Add CIFuzz GitHub action

    Add CIFuzz GitHub action

    Add CIFuzz workflow action to have fuzzers build and run on each PR.

    This is a service offered by OSS-Fuzz where HdrHistogram already runs. CIFuzz can help detect regressions and catch fuzzing build issues early, and has a variety of features e.g. only report issue if it's the PR that is responsible for a given issue (see the URL above). In the current PR the fuzzers gets build on a pull request and will run for 300 seconds.

    opened by DavidKorczynski 0
  • Zero allocation decodeFromByteBuffer

    Zero allocation decodeFromByteBuffer

    Hi!

    I need to merge a huge number of encoded histograms together. I see in the profiler that decoding the histogram (Histogram.decodeFromByteBuffer) allocates a significant amount of memory (creating new count arrays) in my workload. I want to implement an additional approach with histogram decoding with zero allocation.

    The basic idea is to reuse the tmp histogram and decode the data directly into it without allocating a new histogram. Allocating new counting arrays only occurs when the tmp histogram needs to be changed upwards.

    I made some changes locally and achieved a zero allocation.

    @giltene, @mattwarren, @alexvictoor what do you think? Would you mind to review the merge request when I provide it? I'm not quite sure if this library is still supported.

    opened by AlexIvchenko 0
  • Support for GraalVMs native-image

    Support for GraalVMs native-image

    Hi!

    I'm involved in the native effort which is going on in the Spring projects. Our goal is that a Spring (Boot) application works out of the box in a native image. Unfortunately it's not enough that we make our code native-ready, but all the libraries we are using have to support native, too. And this is why I created this issue: your great project is involved some of the Spring projects and we need your help.

    Oracle has created the GraalVM and one of its features is the native-image tool, which allows compiling a JVM application into a native executable. This executable doesn't need a JVM to run, it starts faster and often consumes less memory. But this has downsides, as some dynamic features from Java are not supported without additional configuration. The biggest contenders are reflection, resources and proxies.

    Luckily, a library can ship some JSON metadata in the META-INF/native-image/... directory which enables those features.

    For libraries which don't (or can't) add the metadata in their JARs, Oracle has created the graalvm-reachability-repository, which contains this metadata outside of the libraries JAR file. In an ideal world, all of the metadata is moved into the JARs of the libraries, but until our world has reached its ideal state, this repository will be used.

    There's already metadata for your library in this repository, but it would be great if in future this metadata would reside directly in your codebase. The big advantage is that if your code changes, the metadata can change along with it. Otherwise users would be broken until the graalvm-reachability-metadata is updated.

    What do you think? Are you willing to put this metadata in your codebase? If you have more questions about native-image, please don't hesitate to ask.

    opened by mhalbritter 0
  • Histograms are no longer as accurate in 2.1.10

    Histograms are no longer as accurate in 2.1.10

    In versions of HDRHistogram up to and including 2.1.9, a DoubleHistogram(1000000, 4) had a correlation coefficient greater than 0.99 with true quantiles in our generative tests. However, it appears that 2.1.10 introduced what appear to be significant changes to quantile estimation. For instance, consider the DoubleHistogram estimated values for the following seven numbers (one zero and six 0.1s).

    (def points [0.01 0.01 0.01 0.01 0.01 0.0 0.01])
    

    Now let's create an HDRHistogram and fill it with these points:

    (require '[tesser.quantiles :as q])
    (def h (q/hdr-histogram {:highest-to-lowest-value-ratio 1e6, :significant-value-digits 4}))
    (reduce q/add-point! h points)
    

    The values reported for DoubleHistogram.getValueAtPercentile appear to have changed. Here we compare the actual values for each point to the estimated quantile (expressed as fractions from 0-1) from the histogram--the :estimate figures here are just DoubleHistogram.getValueAtPercentile(1/7 * 100) and so on.

    ; 2.1.9
    user=> (pprint (qt/quantile-comparison h points))
    (#tesser.quantiles_test.QC{:quantile 1/7, :actual 0.0, :estimate 0.0}
     #tesser.quantiles_test.QC{:quantile 2/7,
                               :actual 0.01,
                               :estimate 0.009999752044677734}
     #tesser.quantiles_test.QC{:quantile 3/7,
                               :actual 0.01,
                               :estimate 0.009999752044677734}
     #tesser.quantiles_test.QC{:quantile 4/7,
                               :actual 0.01,
                               :estimate 0.009999752044677734}
     #tesser.quantiles_test.QC{:quantile 5/7,
                               :actual 0.01,
                               :estimate 0.009999752044677734}
     #tesser.quantiles_test.QC{:quantile 6/7,
                               :actual 0.01,
                               :estimate 0.009999752044677734}
     #tesser.quantiles_test.QC{:quantile 1,
                               :actual 0.01,
                               :estimate 0.009999752044677734})
    
    ; 2.1.10
    user=> (pprint (qt/quantile-comparison h points))
    (#tesser.quantiles_test.QC{:quantile 1/7,
                               :actual 0.0,
                               :estimate 0.009999752044677734}
     #tesser.quantiles_test.QC{:quantile 2/7,
                               :actual 0.01,
                               :estimate 0.009999752044677734}
     #tesser.quantiles_test.QC{:quantile 3/7,
                               :actual 0.01,
                               :estimate 0.009999752044677734}
     #tesser.quantiles_test.QC{:quantile 4/7,
                               :actual 0.01,
                               :estimate 0.009999752044677734}
     #tesser.quantiles_test.QC{:quantile 5/7,
                               :actual 0.01,
                               :estimate 0.009999752044677734}
     #tesser.quantiles_test.QC{:quantile 6/7,
                               :actual 0.01,
                               :estimate 0.009999752044677734}
     #tesser.quantiles_test.QC{:quantile 1,
                               :actual 0.01,
                               :estimate 0.009999752044677734})
    

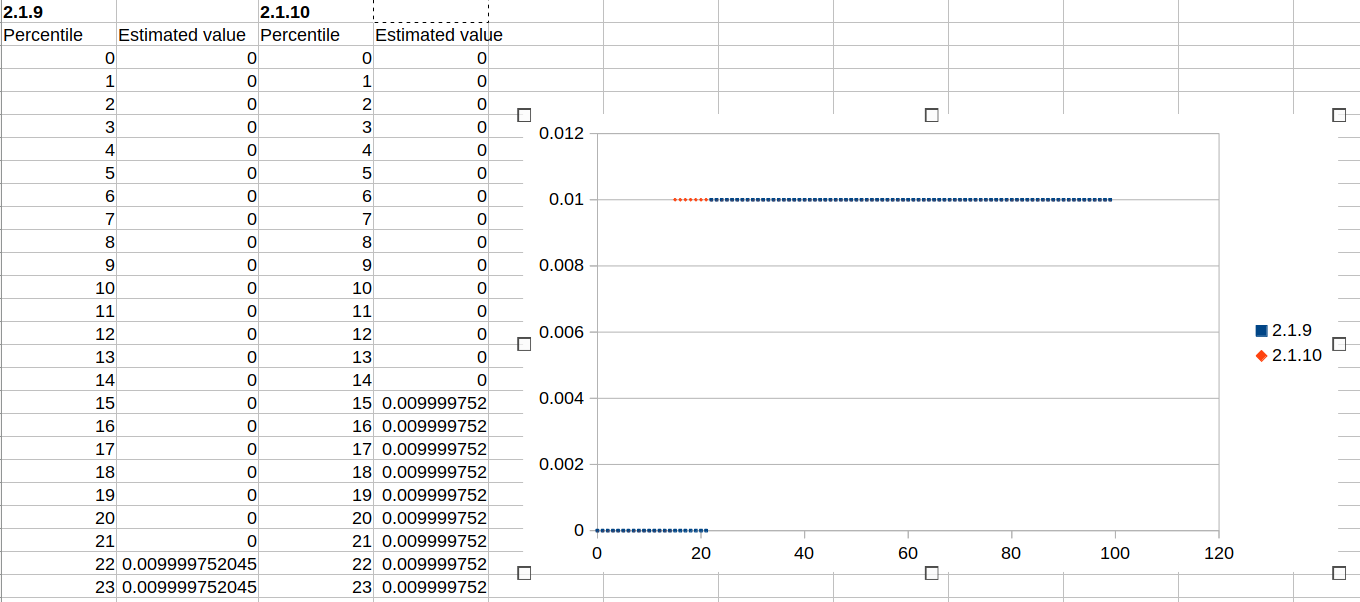
    You would expect, I think, that given seven points the value at quantile 1/7 would be the first point. This used to be the case--it was previously estimated at 0.0, but in 2.10 it's now 0.999. In fact, the entire lower quantile estimator now looks very different. Let's print out all the percentiles from 0-99 as a TSV:

    (doseq [p (range 100)] (println p "\t" (.getValueAtPercentile h p)))
    

    quantile-comparison.ods

    Screenshot from 2022-07-22 18-34-59

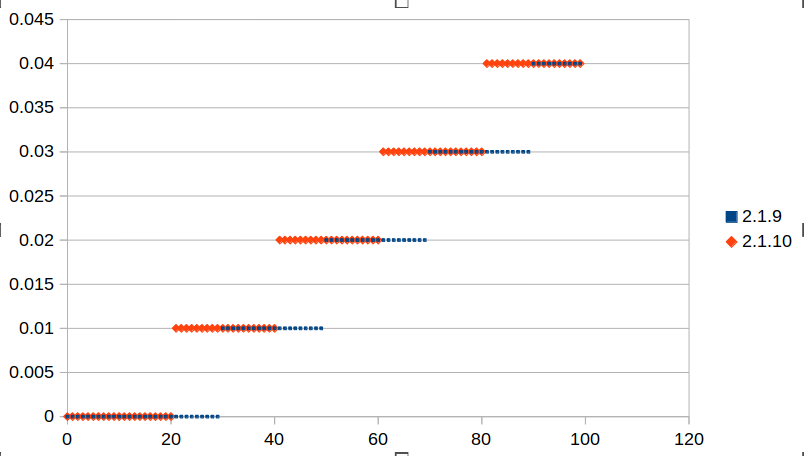
    Note that 1/7 is 0.142, which is where the transition from the first to second point (0 -> 0.1) happens 2.1.10. 2/7 is 0.28. Their midpoint, 1.5/7, is 0.214--that's where the old transition was. This almost feels like the fenceposts got shifted from the midpoints between "true" quantiles to start at or just above the lower of the two quantiles. To get a better feel for this, here's a uniform distribution of 5 points:

    (def points [0.00 0.01 0.02 0.03 0.04])
    (def h (q/hdr-histogram {:highest-to-lowest-value-ratio 1e6, :significant-value-digits 4}))
    (reduce q/add-point! h points)
    

    This gives us the following estimated distributions: quantile-comparison-2.ods

    Screenshot from 2022-07-22 18-45-18

    I haven't been in the guts of how quantiles are defined recently, so I'm honestly not sure which of these behaviors is correct. The 2.1.10 behavior sort of looks better, because it divides the range into 5 evenly-sized buckets. The 2.1.9 behavior looks a little weirder, because the first point's "bucket" is larger, and the last point's "bucket" is half-sized. On the other hand, the new behavior gives us a sort of weird thing where asking for a point whose position in the distribution you know exactly will sometimes give you the wrong value, because the new distribution's boundaries fall exactly on the quantile positions, and floating-point error might put you on the wrong side of that boundary. The 2.1.9 behavior was insensitive to this because the bucket covered the entire area around the "true" quantile. In 2.1.10, quantiles that can't be perfectly represented as doubles can push you over the boundary into the wrong bucket--that's why this bug manifests for collections of 7 points (since 1/7 doesn't have an exact double representation) but 5 points are fine (since 0.2 is exact).

    ; With 5 points, we get the right answer
    user=> (.getValueAtPercentile h (* 100 1/5))
    0.0 ; 2.1.9
    0.0 ; 2.1.10
    
    ; But with 7 points...
    user=> (.getValueAtPercentile h (* 100 1/7))
    0.0 ; 2.1.9
    0.00999 ; 2.1.10
    

    Every time I start digging into quantile definitions my head starts to spin, but I think 2.10's behavior is at variance with Wikipedia's quantile definition. The first 7-quantile of a seven-element collection would be rank 1/7 * 7 = 1, which should be the first element, which is 0, not 0.1. The 14.29% percentile of a seven-element collection should be at rank round(14.29/100 * 7), which is round(1.0003), which is rank 1. The first element in our seven-element collection is 0.0. 2.1.9 gives the correct answer here, but 2.1.10 gives (an approximation to) the second element instead.

    (.getValueAtPercentile h 14.29)
    0.0              ; 2.1.9
    0.009999... ; 2.1.10
    

    Does this sound right to you? I think this is both a regression and... maybe less correct than it needs to be? Or did HDRHistogram maybe choose a different definition of how percentiles work?

    opened by aphyr 0
  • ArrayIndexOutOfBounds in DoubleHistogram.recordValue

    ArrayIndexOutOfBounds in DoubleHistogram.recordValue

    Hello there,

    I am having some issues when recording values, here is a small test that can reproduce the problem using HdrHistogram 2.1.12:

    import org.HdrHistogram.DoubleHistogram;
    import org.junit.jupiter.api.Test;
    
    import static org.assertj.core.api.Assertions.assertThatNoException;
    
    
    class DoubleHistogramTest {
    
        @Test
        void recordValue() {
            var values = new double[]{
                0.1473766911865831,
                0.06643103322406599,
                1.45519152283669E-11,
                1.45984899931293E-77
            };
    
            var histogram = new DoubleHistogram( 5);
            histogram.setAutoResize(true);
            for (double value : values) {
                assertThatNoException().isThrownBy(() -> histogram.recordValue(value));
            }
        }
    
    }
    

    With this I am getting the following result:

    Expecting code not to raise a throwable but caught
      "java.lang.ArrayIndexOutOfBoundsException: The value 1.45984899931293E-77 is out of bounds for histogram, current covered range [1.4551915228366852E-11, 0.25) cannot be extended any further.
    Caused by: java.lang.ArrayIndexOutOfBoundsException: Cannot resize histogram covered range beyond (1L << 63) / (1L << 17) - 1.
    Caused by: java.lang.ArrayIndexOutOfBoundsException: Operation would overflow, would discard recorded value counts
    	at org.HdrHistogram.DoubleHistogram.autoAdjustRangeForValueSlowPath(DoubleHistogram.java:445)
    	at org.HdrHistogram.DoubleHistogram.autoAdjustRangeForValue(DoubleHistogram.java:411)
    	at org.HdrHistogram.DoubleHistogram.recordSingleValue(DoubleHistogram.java:364)
    	at org.HdrHistogram.DoubleHistogram.recordValue(DoubleHistogram.java:289)
    	at org.neo4j.gds.result.DoubleHistogramTest.lambda$recordValue$0(DoubleHistogramTest.java:42)
    

    I've been digging through the code and found https://github.com/HdrHistogram/HdrHistogram/blob/7b0edce258c0847387e3ed532057556b1cc6bd9d/src/main/java/org/HdrHistogram/DoubleHistogram.java#L408

    I am going on a hunch here but I think the comparison should take into an account the numberOfSignificantValueDigits of the passed value.

    opened by vnickolov 0
Releases(HdrHistogram-2.1.12)
  • HdrHistogram-2.1.12(Dec 10, 2019)

    • Fixes https://github.com/HdrHistogram/HdrHistogram/issues/156
    • Adds packed histogram variants. Recorder variants can now be (optionally) constructed to use packed histogram variants.
    • Adds packed array sub-package
    Source code(tar.gz)
    Source code(zip)
Utilities for HDR Histogram logs manipulation

HdrLogProcessing Utilities for HDR Histogram logs manipulation. This repo currently includes utilities for summarizing and unioning of logs. Requires

Nitsan Wakart 29 May 25, 2022
A beautiful material calendar with endless scroll, range selection and a lot more!

CrunchyCalendar A light, powerful and easy to use Calendar Widget with a number out of the box features: Infinite vertical scrolling in both direction

CleverPumpkin 484 Jan 7, 2023
Customizable calendar with animations and ability to select a day, a week, a month or a custom range

?? RangeCalendarView A customizable, easy-to-use calendar with range selection Screenshots Getting started This library is available on Maven Central,

Oleg Khmaruk 10 May 20, 2022
cglib - Byte Code Generation Library is high level API to generate and transform Java byte code. It is used by AOP, testing, data access frameworks to generate dynamic proxy objects and intercept field access.

cglib Byte Code Generation Library is high level API to generate and transform JAVA byte code. It is used by AOP, testing, data access frameworks to g

Code Generation Library 4.5k Jan 8, 2023
A high available,high performance distributed messaging system.

#新闻 MetaQ 1.4.6.2发布。更新日志 MetaQ 1.4.6.1发布。更新日志 MetaQ 1.4.5.1发布。更新日志 MetaQ 1.4.5发布。更新日志 Meta-ruby 0.1 released: a ruby client for metaq. SOURCE #介绍 Meta

dennis zhuang 1.3k Dec 12, 2022
Spring-Boot-Plus is a easy-to-use, high-speed, high-efficient,feature-rich, open source spring boot scaffolding

Everyone can develop projects independently, quickly and efficiently! What is spring-boot-plus? A easy-to-use, high-speed, high-efficient, feature-ric

geekidea 2.3k Dec 31, 2022
Vibur DBCP - concurrent and dynamic JDBC connection pool

Vibur DBCP is concurrent, fast, and fully-featured JDBC connection pool, which provides advanced performance monitoring capabilities, including slow S

Vibur 94 Apr 20, 2022
Dynamic Code Evolution VM for Java 7/8

NEWS: Dcevm-11 on Trava OpenJDK There is a new distribution channel for DCEVM-11 binaries on - TravaOpenjdk! DCEVM This project is a fork of original

null 1.6k Dec 28, 2022
Zuul is a gateway service that provides dynamic routing, monitoring, resiliency, security, and more.

Zuul Zuul is an L7 application gateway that provides capabilities for dynamic routing, monitoring, resiliency, security, and more. Please view the wik

Netflix, Inc. 12.4k Jan 3, 2023
Java reporting library for creating dynamic report designs at runtime

Master Development Dynamic Reports DynamicReports is an open source Java reporting library based on JasperReports. It allows to create dynamic report

Dynamic Reports 165 Dec 28, 2022
Rest.li is a REST+JSON framework for building robust, scalable service architectures using dynamic discovery and simple asynchronous APIs.

Rest.li is an open source REST framework for building robust, scalable RESTful architectures using type-safe bindings and asynchronous, non-blocking I

LinkedIn 2.3k Dec 29, 2022
BTrace - a safe, dynamic tracing tool for the Java platform

btrace A safe, dynamic tracing tool for the Java platform Version 2.1.0 Quick Summary BTrace is a safe, dynamic tracing tool for the Java platform. BT

btrace.io 5.3k Jan 9, 2023
Dynamic JavaFX form generation

FXForm 2 Stop coding forms: FXForm 2 can do it for you! About FXForm2 is a library providing automatic JavaFX form generation. How does it work? Write

dooApp 209 Jan 9, 2023
dynamic datasource for springboot 多数据源 动态数据源 主从分离 读写分离 分布式事务

一个基于springboot的快速集成多数据源的启动器 简介 dynamic-datasource-spring-boot-starter 是一个基于springboot的快速集成多数据源的启动器。 其支持 Jdk 1.7+, SpringBoot 1.4.x 1.5.x 2.x.x。 文档 | D

baomidou 3.8k Dec 31, 2022
MixStack lets you connects Flutter smoothly with Native pages, supports things like Multiple Tab Embeded Flutter View, Dynamic tab changing, and more. You can enjoy a smooth transition from legacy native code to Flutter with it.

中文 README MixStack MixStack lets you connects Flutter smoothly with Native pages, supports things like Multiple Tab Embeded Flutter View, Dynamic tab

Yuewen Engineering 80 Dec 19, 2022
ONLINE DYNAMIC UNIVERSITY VOTING SYSTEM

WEVOTE ONLINE DYNAMIC UNIVERSITY VOTING SYSTEM Online university voting system is developed as a web-based application using html for front-end design

null 3 May 7, 2021
🔥 强大的动态线程池,附带监控线程池功能(没有依赖任何中间件)。Powerful dynamic thread pool, does not rely on any middleware, with monitoring thread pool function.

ThreadPool, so easy. 动态线程池监控,主意来源于美团技术公众号 点击查看美团线程池文章 看了文章后深受感触,再加上最近线上线程池的不可控以及不可逆等问题,想做出一个兼容性、功能性、易上手等特性集于一身的的开源项目。目标还是要有的,虽然过程可能会艰辛 目前这个项目是由作者独立开发,

龙台 3.4k Jan 3, 2023
Dynamic Configuration Capability for SpringBoot Application

Spring Boot Dynamic Config Hot-reload your SpringBoot configurations, with just a '@DynamicConfig' annotation, the simplest solution, ever. English 简体

Joey Yang 153 Jan 3, 2023
🔥 强大的动态线程池,附带监控线程池功能(没有依赖任何中间件)。Powerful dynamic thread pool, does not rely on any middleware, with monitoring thread pool function.

?? 动态线程池系统,包含 Server 端及 SpringBoot Client 端需引入的 Starter. 动态线程池监控,主意来源于美团技术公众号 点击查看美团线程池文章 看了文章后深受感触,再加上最近线上线程池的不可控以及不可逆等问题,想做出一个 兼容性、功能性、易上手等特性 集于一身的的

龙台 3.4k Jan 3, 2023