52 Repositories
Java monitoring Libraries
Sidekick is a live application debugger that lets you troubleshoot your applications while they keep on running
Explore Docs » Quick Start Tutorial » Table of Contents What is Sidekick? Sidekick Actions Why Sidekick? Features Who should use Sidekick? How does Si
Sentry is cross-platform application monitoring, with a focus on error reporting.
Users and logs provide clues. Sentry provides answers. What's Sentry? Sentry is a developer-first error tracking and performance monitoring platform t
Highly customized business metrics monitoring with TDengine & Spring Boot

Horus —— Highly customized business metrics monitoring with TDengine & Spring Boot 给予业务指标监控的高度定制自由 设计文档:https://akhnhwmr9k.feishu.cn/wiki/wikcnJJFmDHj
Tasks Planner : A minimalist collaborative app for scheduling and managing your tasks with the team and getting notifications through discord.
Tasks Planner ✨ Overview Tasks planner is a minimalist collaborative app for planning and managing your tasks with the team and get notifications thro
A Time Series Data Browser
Contents What is binjr? Features Getting started Trying it out Getting help Contributing How is it licensed? What is binjr? binjr is a time series bro
SpringBoot service to pick up CAN messages retransmitted by CANBridge and extract certain values for reporting/monitoring/alerting via DataDog

SpringBoot service to pick up CAN messages retransmitted by CANBridge and extract certain values for reporting/monitoring/alerting via DataDog
Beispielprojekt für Monitoring mit Prometheus und Grafana
Beispielprojekt für Monitoring mit Prometheus und Grafana Software git Für die Java Beispiel Java JDK in Version 17. Docker und docker-compose empfohl
The Prometheus monitoring system and time series database.
Prometheus Visit prometheus.io for the full documentation, examples and guides. Prometheus, a Cloud Native Computing Foundation project, is a systems
Distributed Tracing, Metrics and Context Propagation for application running on the JVM
Kamon Kamon is a set of tools for instrumenting applications running on the JVM. The best way to get started is to go to our official Get Started Page
inspectIT is the leading Open Source APM (Application Performance Management) tool for analyzing your Java (EE) applications.

🔥 inspectIT OpenCensus Edition has been released 🔥 The inspectIT OCE project provides an improved Java agent newly developed from scratch focusing o
APM, Application Performance Monitoring System
Apache SkyWalking SkyWalking: an APM(application performance monitor) system, especially designed for microservices, cloud native and container-based
An open source SQL database designed to process time series data, faster
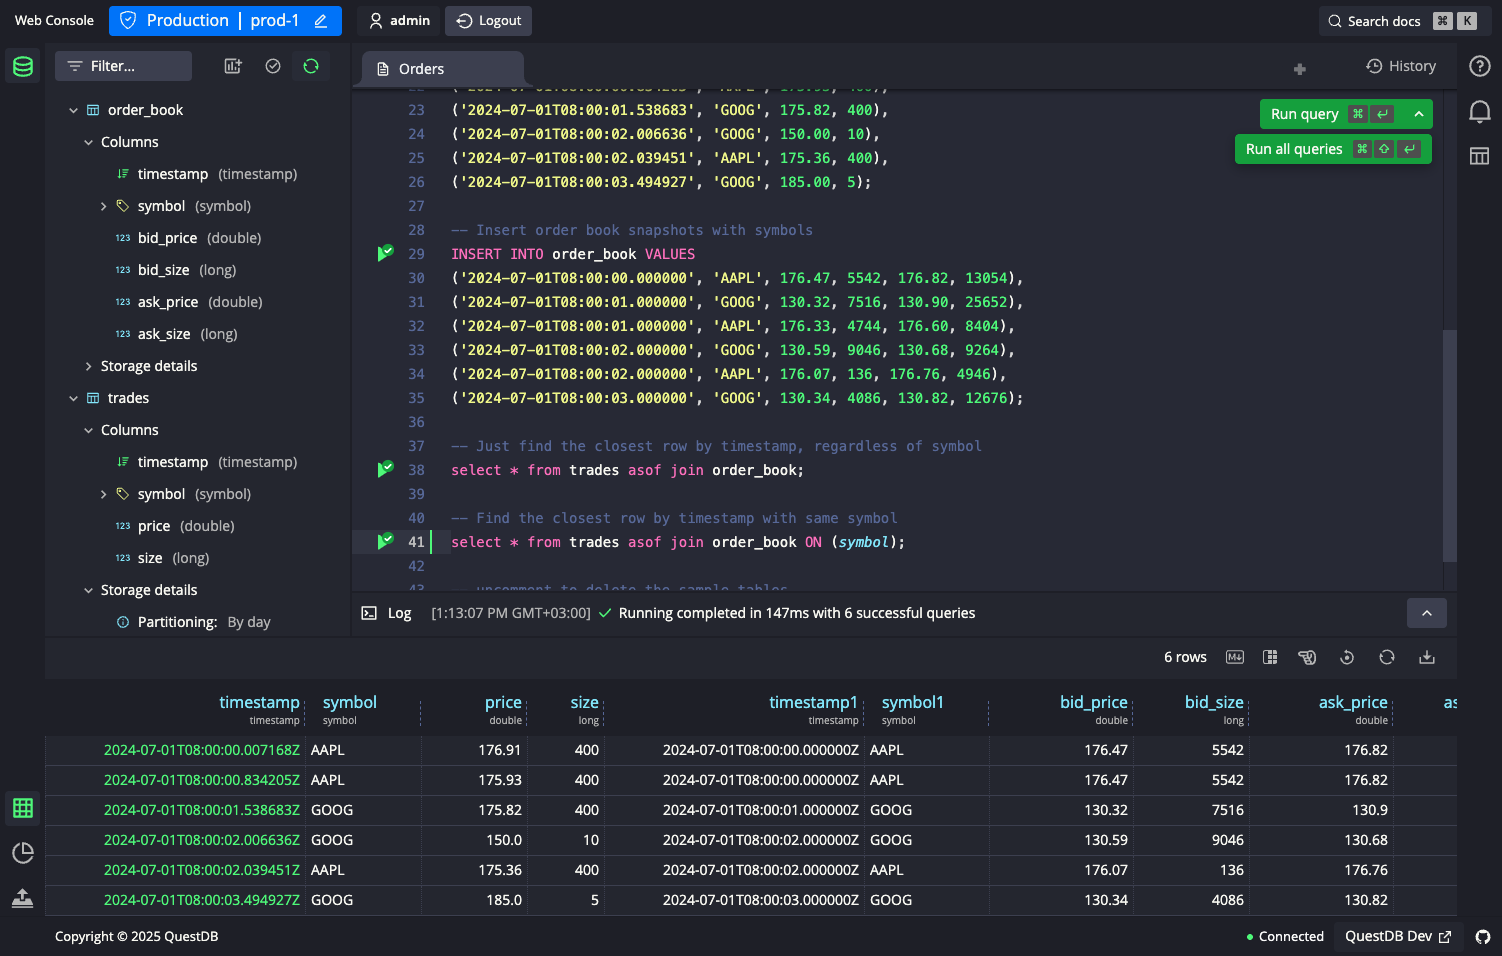
English | 简体中文 | العربية QuestDB QuestDB is a high-performance, open-source SQL database for applications in financial services, IoT, machine learning
The Heroic Time Series Database
DEPRECATION NOTICE This repo is no longer actively maintained. While it should continue to work and there are no major known bugs, we will not be impr
Time Series Metrics Engine based on Cassandra
Hawkular Metrics, a storage engine for metric data About Hawkular Metrics is the metric data storage engine part of Hawkular community. It relies on A
Time series monitoring and alerting platform.

Argus Argus is a time-series monitoring and alerting platform. It consists of discrete services to configure alerts, ingest and transform metrics & ev
Intent traffic monitoring tool.

XIntent An Intent traffic monitoring tool. Purpose App security testing or bug hunting. Intent IPC mechanism learning. App keep-alive behavior monitor
The state-of-the-art Dashboard of Apache RoccketMQ provides excellent monitoring capability. Various graphs and statistics of events, performance and system information of clients and application is evidently made available to the user.
RocketMQ Dashboard How To Install With Docker get docker image mvn clean package -Dmaven.test.skip=true docker:build or docker pull apacherocketmq/ro
🔥 强大的动态线程池,并附带监控报警功能(没有依赖中间件),完全遵循阿里巴巴编码规范。Powerful dynamic thread pool, does not rely on any middleware, with monitoring and alarm function.
🔥 动态线程池(DTP)系统,包含 Server 端及 SpringBoot Client 端需引入的 Starter. 这个项目做什么? 动态线程池(Dynamic-ThreadPool),下面简称 DTP 系统 美团线程池文章 介绍中,因为业务对线程池参数没有合理配置,触发过几起生产事故,进而
Two Spring-boot applications registering themselves to an spring-boot-admin-server application as separate clients for the purpose of monitoring and managing the clients

Spring-boot-admin implementation with 1 Server and 2 clients Creating a Server application to monitor and manage Spring boot applications (clients) un
🔥 强大的动态线程池,附带监控线程池功能(没有依赖任何中间件)。Powerful dynamic thread pool, does not rely on any middleware, with monitoring thread pool function.
🔥 动态线程池系统,包含 Server 端及 SpringBoot Client 端需引入的 Starter. 动态线程池监控,主意来源于美团技术公众号 点击查看美团线程池文章 看了文章后深受感触,再加上最近线上线程池的不可控以及不可逆等问题,想做出一个 兼容性、功能性、易上手等特性 集于一身的的
🔥 强大的动态线程池,附带监控线程池功能(没有依赖任何中间件)。Powerful dynamic thread pool, does not rely on any middleware, with monitoring thread pool function.
ThreadPool, so easy. 动态线程池监控,主意来源于美团技术公众号 点击查看美团线程池文章 看了文章后深受感触,再加上最近线上线程池的不可控以及不可逆等问题,想做出一个兼容性、功能性、易上手等特性集于一身的的开源项目。目标还是要有的,虽然过程可能会艰辛 目前这个项目是由作者独立开发,
ThirdEye is an integrated tool for realtime monitoring of time series and interactive root-cause analysis.
ThirdEye is an integrated tool for realtime monitoring of time series and interactive root-cause analysis. It enables anyone inside an organization to collaborate on effective identification and analysis of deviations in business and system metrics. ThirdEye supports the entire workflow from anomaly detection, over root-cause analysis, to issue resolution and post-mortem reporting.
APM, (Application Performance Management) tool for large-scale distributed systems.

Visit our official web site for more information and Latest updates on Pinpoint. Latest Release (2020/01/21) We're happy to announce the release of Pi
Best-of-breed OpenTracing utilities, instrumentations and extensions
OpenTracing Toolbox OpenTracing Toolbox is a collection of libraries that build on top of OpenTracing and provide extensions and plugins to existing i
A platform for visualization and real-time monitoring of data workflows

Status This project is no longer maintained. Ambrose Twitter Ambrose is a platform for visualization and real-time monitoring of MapReduce data workfl
Best-of-breed OpenTracing utilities, instrumentations and extensions
OpenTracing Toolbox OpenTracing Toolbox is a collection of libraries that build on top of OpenTracing and provide extensions and plugins to existing i
Small set of tools for JVM troublshooting, monitoring and profiling.
Swiss Java Knife (SJK) SJK is a command line tool for JVM diagnostic, troubleshooting and profiling. SJK exploits standard diagnostic interfaces of JV
An application metrics facade for the most popular monitoring tools. Think SLF4J, but for metrics.
Micrometer Application Metrics An application metrics facade for the most popular monitoring tools. Instrument your code with dimensional metrics with
Java monitoring for the command-line, profiler included
jvmtop is a lightweight console application to monitor all accessible, running jvms on a machine. In a top-like manner, it displays JVM internal metri
Performance visualisation tools

grav A collection of tools to help visualise process execution. This blog post has some detail on the rationale and implementation detail. Scheduler p
Performance monitoring and benchmarking suite

Introduction Likwid is a simple to install and use toolsuite of command line applications and a library for performance oriented programmers. It works
BCC - Tools for BPF-based Linux IO analysis, networking, monitoring, and more

BPF Compiler Collection (BCC) BCC is a toolkit for creating efficient kernel tracing and manipulation programs, and includes several useful tools and
A Linux packet crafting tool.
Pig Pig (which can be understood as Packet intruder generator) is a Linux packet crafting tool. You can use Pig to test your IDS/IPS among other stuff
APM, (Application Performance Management) tool for large-scale distributed systems.
Visit our official web site for more information and Latest updates on Pinpoint. Latest Release (2020/01/21) We're happy to announce the release of Pi
Java lib for monitoring directories or individual files via java.nio.file.WatchService
ch.vorburger.fswatch Java lib for monitoring directories or individual files based on the java.nio.file.WatchService. Usage Get it from Maven Central
A lightweight platform monitoring tool for Java VMs
Sysmon - lightweight platform monitoring for Java VMs Sysmon is a lightweight platform monitoring tool. It's designed to gather performance data (CPU,
an open source solution to application performance monitoring for java server applications

Stagemonitor is a Java monitoring agent that tightly integrates with time series databases like Elasticsearch, Graphite and InfluxDB to analyze graphe
Sematext Monitoring Agent
Sematext App Agent This repository contains the source code for Sematext App Agent. Sematext App Agent can be used to collect application metrics from
APM, (Application Performance Management) tool for large-scale distributed systems.
Visit our official web site for more information and Latest updates on Pinpoint. Latest Release (2020/01/21) We're happy to announce the release of Pi
Get inside your JVM

nudge4j · nudge4j is a tiny piece of code to help great developers understand code better, debug less, have more fun. Overview With nudge4j you can: c
JavaMelody : monitoring of JavaEE applications
JavaMelody The goal of JavaMelody is to monitor Java or Java EE applications in QA and production environments. See the Project Home, Screenshots, Use
Endpoint library for the failsafe framework
Failsafe Actuator Failsafe Actuator is a Java library that provides a simple monitoring interface for Spring Boot applications that use the Failsafe l
Automon combines the power of AOP (AspectJ) with monitoring or logging tools you already use to declaratively monitor your Java code, the JDK, and 3rd party libraries.

Automon Automon combines the power of AOP (AspectJ) with monitoring tools or logging tools that you already use to declaratively monitor the following
Best-of-breed OpenTracing utilities, instrumentations and extensions
OpenTracing Toolbox OpenTracing Toolbox is a collection of libraries that build on top of OpenTracing and provide extensions and plugins to existing i
An extensible Java library for HTTP request and response logging

Logbook: HTTP request and response logging Logbook noun, /lɑɡ bʊk/: A book in which measurements from the ship's log are recorded, along with other sa
The Java microservice lib. QBit is a reactive programming lib for building microservices - JSON, HTTP, WebSocket, and REST. QBit uses reactive programming to build elastic REST, and WebSockets based cloud friendly, web services. SOA evolved for mobile and cloud. ServiceDiscovery, Health, reactive StatService, events, Java idiomatic reactive programming for Microservices.
QBit Java Micorservices lib tutorials| QBit Website | QBit uses Reakt | QBit works with Vert.x | Reakt Vertx QBit - The Microservice Lib for Java - JS
A powerful flow control component enabling reliability, resilience and monitoring for microservices. (面向云原生微服务的高可用流控防护组件)

Sentinel: The Sentinel of Your Microservices Introduction As distributed systems become increasingly popular, the reliability between services is beco
A library that simplifies error handling for Functional Programming in Java

Faux Pas: Error handling in Functional Programming Faux pas noun, /fəʊ pɑː/: blunder; misstep, false step Faux Pas is a library that simplifies error
Zuul is a gateway service that provides dynamic routing, monitoring, resiliency, security, and more.
Zuul Zuul is an L7 application gateway that provides capabilities for dynamic routing, monitoring, resiliency, security, and more. Please view the wik
A library that simplifies error handling for Functional Programming in Java
Faux Pas: Error handling in Functional Programming Faux pas noun, /fəʊ pɑː/: blunder; misstep, false step Faux Pas is a library that simplifies error
Vibur DBCP - concurrent and dynamic JDBC connection pool
Vibur DBCP is concurrent, fast, and fully-featured JDBC connection pool, which provides advanced performance monitoring capabilities, including slow S
FlexyPool adds metrics and failover strategies to a given Connection Pool, allowing it to resize on demand.

Introduction The FlexyPool library adds metrics and flexible strategies to a given Connection Pool, allowing it to resize on demand. This is very hand